
Figures & data
FIGURE 1. Map illustrating locations of the 20 shallow tundra ponds located within the Churchill Wildlife Management Area of western Hudson Bay Lowlands that were selected for analyses of water chemistry and water isotope composition in this study.
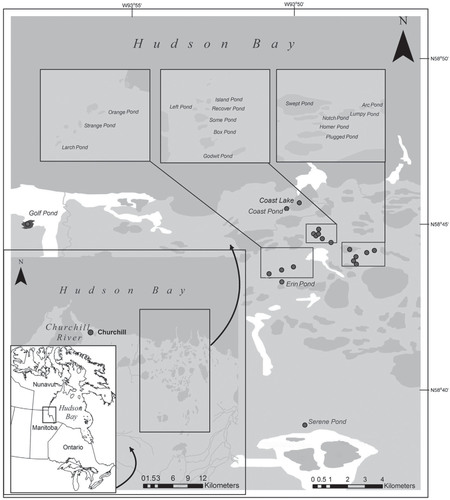
TABLE 1 Geographic location (latitude, longitude), surface area (ha), mean depth (m), and surface area-to-depth ratio for the 20 study ponds within the Churchill Wildlife Management Area.
FIGURE 2. Comparison of (a) mean monthly air temperature, (b) mean monthly relative humidity, and (c) monthly precipitation during 2010 with climate normal data for the period 1971–2000 recorded at the airport at Churchill, Manitoba (Meteorological Station 5060601; CitationEnvironment Canada, 2011a, Citation2011b).
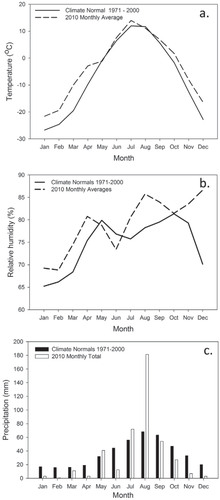
FIGURE 3. Principal component analysis (PCA) ordination diagram illustrating the main gradients of limnological differences among the 20 study ponds based on 16 limnological variables measured during early June, late July, and mid-September 2010. The ponds are located within the Churchill Wildlife Management Area of western Hudson Bay Lowlands. The variables δ18O, δ2H, total nitrogen (TN), and water temperature (lnWtemp) were included as passive variables. Sample scores are labeled using the first three or four letters of their corresponding pond name, and the number represents the sampling episode (1 = early June, 2 = late July, 3 = mid-September). SWCT = seasonal water-chemistry trajectories.
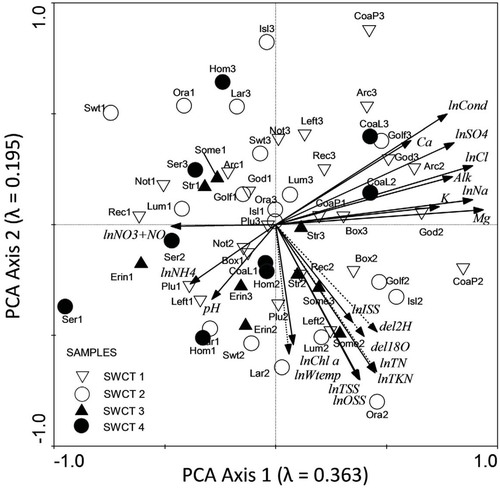
FIGURE 4. Principal component analysis (PCA) ordination diagrams illustrating four distinctive patterns of change in limnological conditions among the 20 study ponds during the ice-free season of 2010. The four distinctive seasonal water-chemistry trajectories (SWCT) are shown in separate panels: (a) SWCT1 (n = 8 ponds); (b) SWCT2 (n = 6); (d) SWCT3 (n = 3); and (e) SWCT4 (n = 3). (c) Vectors for the environmental variable (solid lines represent active variables [n = 16], dotted lines represent passive variables [n = 4]).
![FIGURE 4. Principal component analysis (PCA) ordination diagrams illustrating four distinctive patterns of change in limnological conditions among the 20 study ponds during the ice-free season of 2010. The four distinctive seasonal water-chemistry trajectories (SWCT) are shown in separate panels: (a) SWCT1 (n = 8 ponds); (b) SWCT2 (n = 6); (d) SWCT3 (n = 3); and (e) SWCT4 (n = 3). (c) Vectors for the environmental variable (solid lines represent active variables [n = 16], dotted lines represent passive variables [n = 4]).](/cms/asset/2fefd50b-db52-497e-a45c-42e2445bbba4/uaar_a_11957725_f0005.jpg)
FIGURE 5. Comparison of basin morphometry among the four seasonal water-chemistry trajectory (SWCT) categories of ponds. (a) Boxplots comparing maximum pond depth (m) among the four SWCT categories. (b) Boxplots comparing pond surface area (ha) among the four SWCT categories. (c) Scatterplot illustrating relations between water depth and surface area of the ponds in the four SWCT categories.
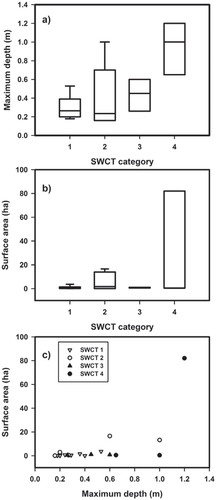
FIGURE 6. Seasonal variation of δ18O compositions of water in the 20 study ponds during the ice-free season of 2010, based on water samples collected in early June, late July, and mid-September. The data are organized by the four seasonal water-chemistry trajectory (SWCT) categories: (a) SWCT1, (b) SWCT2, (c) SWCT3, and (d) SWCT4. The horizontal dashed line in each panel identifies the terminal basin steadystate δ18O value that corresponds to a pond water balance where inflow equals evaporation (δSSL; δ18OSSL = -7.5‰) (further details may be found in CitationWolfe et al., 2011).
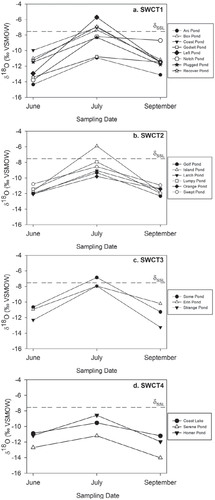
FIGURE 7. Aerial photos showing 3 of the study ponds in July 2011. The left panel illustrates that Left Pond (SWCT1) is hydrologically isolated from the surrounding terrestrial landscape, as illustrated by absence of apparent inflow or outflow channels. The right panel shows 5 ponds which are hydrologically connected by channel fens, which appear as dark green vegetated areas between the ponds. Hydrological information provided by Wolfe et al. (Citation2011) suggests that Larch Lake (SWCT2) lost hydrological connection during the summer months of 2010, whereas Erin Lake (in SWCT3) remained hydrologically connected throughout the ice-free season of 2010. Differences in the duration and timing of the hydrological connections appear to differentiate seasonal patterns of limnological change in ponds of the SWCT categories.
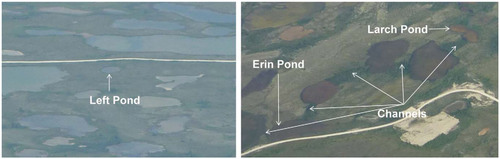
TABLE A1 Values for the limnological variables measured in early June 2010 at the 20 study ponds located in the Churchill Wildlife Management Area. The ponds are arranged according to their surface water-chemistry trajectory (SWCT) category (see text for details).
TABLE A2 Values for the limnological variables measured in late July 2010 at the 20 study ponds located in the Churchill Wildlife Management Area. The ponds are arranged according to their surface water-chemistry trajectory (SWCT) category (see text for details).
TABLE A3 Values for the limnological variables measured in mid-September 2010 at the 20 study ponds located in the Churchill Wildlife Management Area. The ponds are arranged according to their surface water-chemistry trajectory (SWCT) category (see text for details).