Figures & data
FIGURE 1. Study species E. grandiflora (left) and C. tessellata (right) at natural locations in the field.
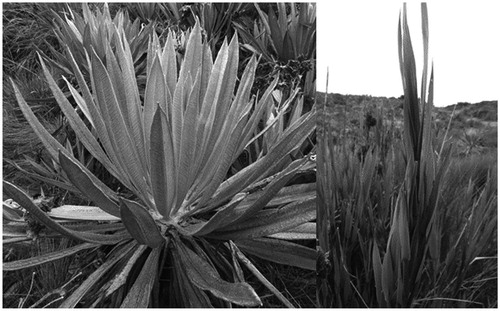
FIGURE 2. Instantaneous photon flux density (PFD) incident on a horizontal plane (PFDs and Ta respectively) during the study period (A, B), plus hourly values for the coldest (C, D) and warmest (E, F) days measured (3/26/12 and 3/27/12, respectively).
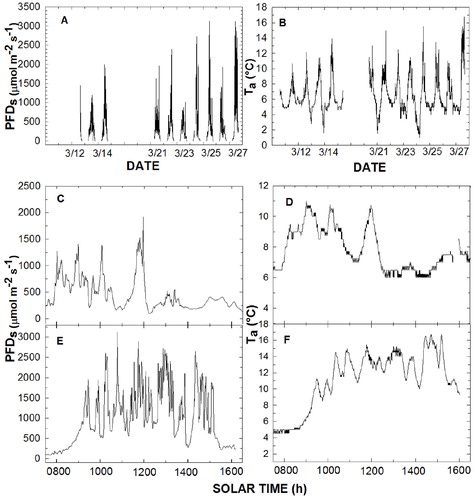
FIGURE 3. (A). Mean hourly PFD measured at the central location (PFDs) for all sampling days and (B) mean percent of daylight hours when indicated values (intervals) of PFD occurred. PFD Intervals were 50 to 1500 μmol m-2 s-1 and then 100 μmol m-2 s-1. Greatest values at 2800–2900 and at more than 3000 μmol m-2 s-1 had a frequency of 0.02% and 0.03%, respectively.
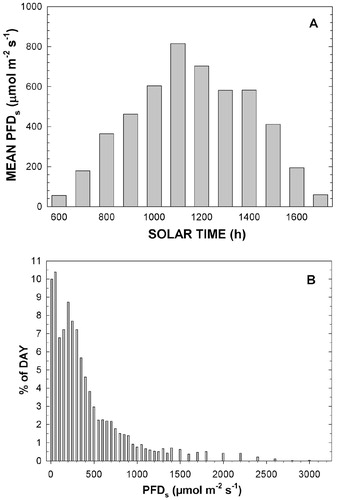
FIGURE 4. Nighttime air temperatures for the coldest (light line; 3/24/12) and warmest night (bold line; 3/23/12) during the study period.
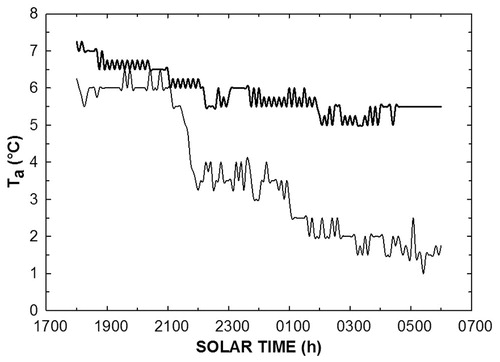
FIGURE 5. Estimating leaf orientation effects on PFDl using comparisons with the horizontal PFD sensor located at the central site location. The number of percent reductions in PFD due to a nonhorizontal leaf orientation were calculated as the percent difference between PFDs and PFDl, i.e. [(PFDs - PFDl)/(PFD ) × 100] for Espeletia grandiflora (black) and Chusquea tessellata (gray) for all corresponding PFD measurements. Number of occurrences were pooled from data on nine leaves from three individuals per species measured over 11 days.
![FIGURE 5. Estimating leaf orientation effects on PFDl using comparisons with the horizontal PFD sensor located at the central site location. The number of percent reductions in PFD due to a nonhorizontal leaf orientation were calculated as the percent difference between PFDs and PFDl, i.e. [(PFDs - PFDl)/(PFD ) × 100] for Espeletia grandiflora (black) and Chusquea tessellata (gray) for all corresponding PFD measurements. Number of occurrences were pooled from data on nine leaves from three individuals per species measured over 11 days.](/cms/asset/94caa3ab-fc1c-49c8-93ed-aec75f31a95c/uaar_a_11957740_f0005.jpg)
FIGURE 6. Hourly variation in PFDl and Tl in E. grandiflora and C. tessellata leaves on the coldest (A and B; E and F; 3/26/12) and warmest day (C and D; G and H; 3/27/12).
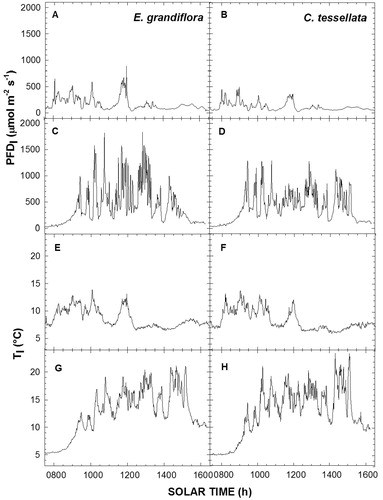
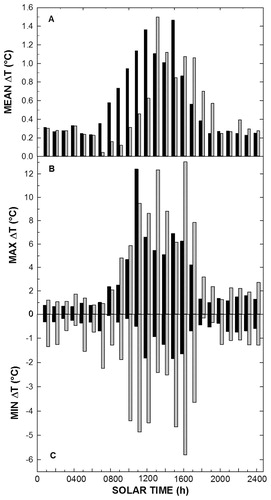
FIGURE 6. (A) Hourly mean, (B) maximum, and (C) minimum temperature differences between the leaf (Tl) and air temperature (Ta) for E. grandiflora (black) and C. tessellata (gray) measured over the entire study period, i.e. ΔT = Tl - Ta.