
Figures & data
FIGURE 1. Topographic map of the Sugnugur basin, Mongolia. Shown are the positions of the lower study site (star, small map) and the upper study site (detailed map).
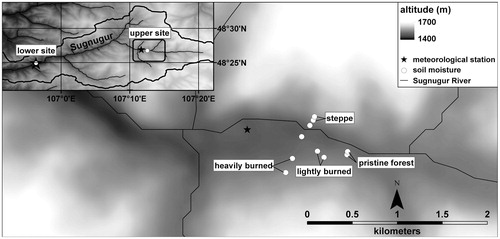
FIGURE 2. View over the research area at the upper site. The steep left slopes are vegetated steppe, whereas slopes on the right are covered with burned and pristine taiga.
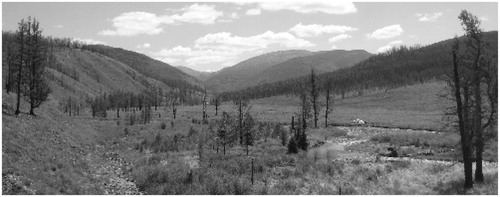
FIGURE 3. Monthly air temperature (°C) and precipitation (mm) values measured at the lower steppe site from January 2011 until December 2012.
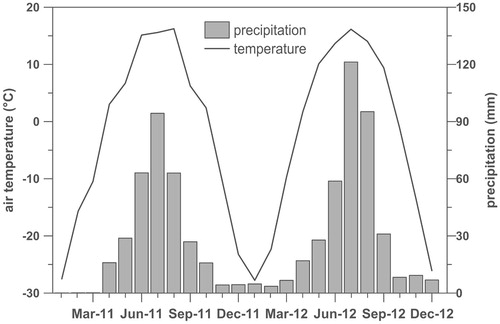
FIGURE 4. Measured unsaturated soil matrix (SM) and macropore (MP) infiltration rates (I) in m day-1 of the upslope (US) and downslope (DS) sites of the steppe (S), lightly burned forest (LB), heavily burned forest (HB), pristine forest (P), and the floodplain (F).
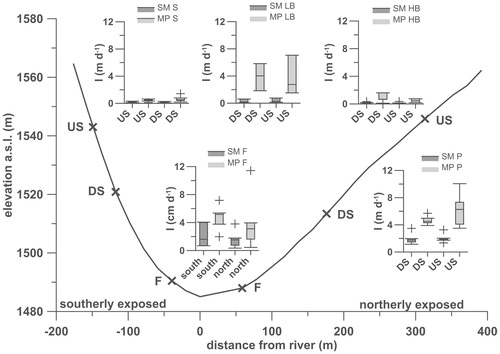
TABLE 1 Mean soil temperature in °C and standard deviation at the up-slope sites during the observation period from 23 July to 1 September 2012, and minima and maxima of daily soil temperature values.
FIGURE 5. Mean soil temperatures (°C) at the upper slope of the pristine forest, the heavily burned forest, and the steppe site. Soil temperatures were measured in triple replicates at depth of 0.05, 0.1, and 0.3 m at all sites and additionally at 0.5 m at the heavily burned site.
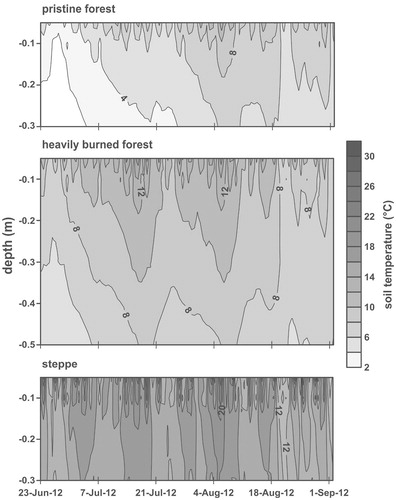
FIGURE 6. Volumetric soil moisture contents (VWC) in m3 m-3 across the transects at depths of 0.05, 0.1, and 0.3 m from 5 July 2011 to 3 September 2012. Depicted are the mean values of the down- and up-slope plots at each site. FDR sensors of the lightly burned forest were removed at the beginning of June 2012 and installed in the pristine forest.
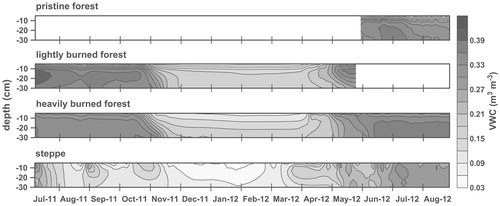
FIGURE 7. Determined soil dryness rates in %v day-1 for the summer period of 2011 (n = 4) and 2012 (n = 7). The lightly burned sites were shifted toward the pristine forest at the beginning of June 2012.
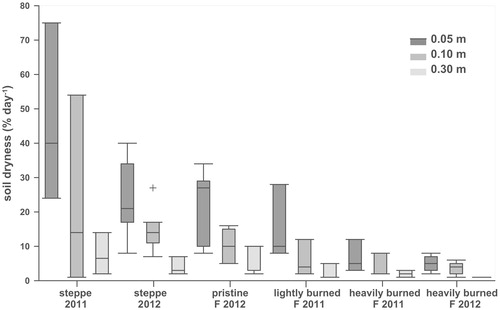
FIGURE 8. Results of the variation in soil moisture content determined from the pressure plate analysis of the soils from the steppe, lightly and heavily burned forest slopes, each at a depth of 0.05, 0.1, and 0.3 m. The best-fit curves were defined according to the method proposed by van Genuchten (Citation1980).
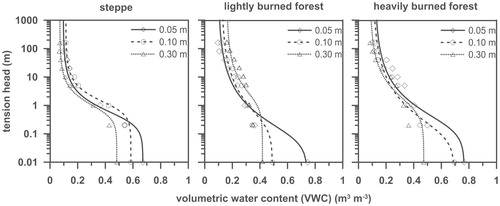
TABLE 2 Daily mean volumetric water content (VWC) in m3 m-3 during the observation period from 5 July until 3 September, 2011 and 2012, across the soil moisture transects. Minimum and maximum recorded VWCs are listed to account for the soil moisture dynamics at each site.