Figures & data
FIGURE 1. Map of sampling location at Midtre Lovénbreen close to Ny-Ålesund, Svalbard (Norsk Polar Institute).
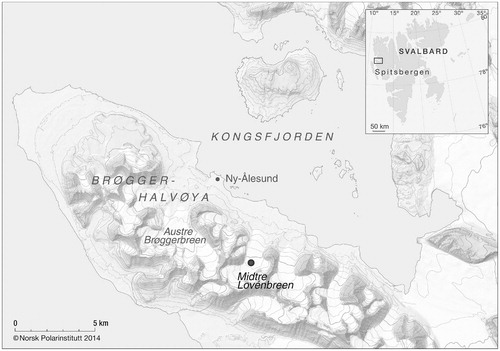
FIGURE 2. Schematic sketch of the snow pit at Midtre Lovénbreen where six lysimeters were installed on 19 June 2010. The lysimeters were installed approximately 10 cm above the basal ice layer to prevent any water, flowing on top of the glacier ice, from entering the lysimeters.
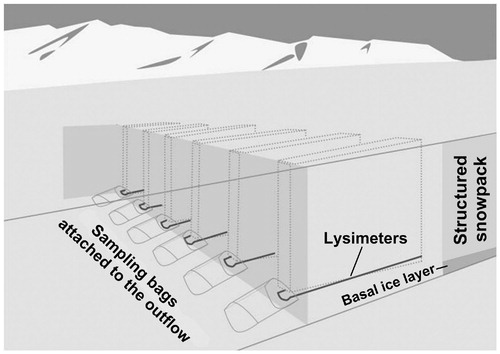
TABLE 1 Conductivity (σcond.), melt index, cell abundance, and the abundance of mineral dust particles (MPs) of the snow layers sampled at the start of the elution measurements. The melt index was calculated as log [Na+/Mg2+] for concentrations in µeg L-1. The abundance of MPs is presented on a categorical scale: 1 = number of MPs apparently lower than number of cells, 2 = abundance of MPs close to the abundance of microbial cells, 3 = abundance of MPs apparently exceeding the number of microbial cells, and 4 = abundance of MPs exceeding the number of microbial cells many times.
FIGURE 3. (a) Snowpack thickness (z snow) and cell abundance, (b) ammonium, (c) potassium, (d) magnesium, and (e) calcium at the start of the elution measurements. (f) Snowpack stratigraphy analyzed by the hand test method (ICSI-IAHS, 1981) and numbered individual snow layers; concentrations of (g) chloride and sodium (gray), (h) sulfate and non-sea salt sulfate (gray), (i) nitrate, and (j) fluoride.
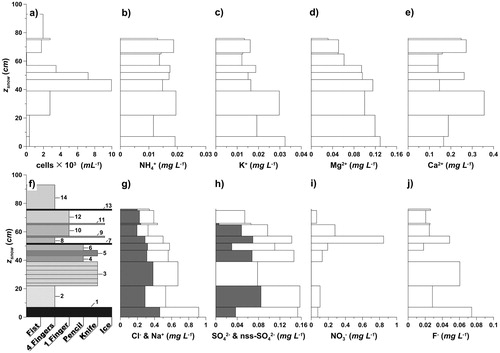
TABLE 2 Correlation matrix for the major ion concentrations, pH, conductivity (σcond.), melt index, and cell abundance of the 14 sampled snow layers in and . Bold numbers indicate strong correlations.
FIGURE 4. The elution progress and snowpack development of; (a) snow thickness (z snow) and modeled snow water equivalence (z SWE, dotted line); (b) cell counts (with linear regression line) and Ca2+; (c) Cl-and Na+; (d) NO3 -and SO4 2-; (e) estimated air temperature assuming a dry adiabatic lapse rate and 200 m elevation difference from Ny-Ålesund (data provided by AWI; S. Debatin), and modeled meltwater discharge (dotted line); (f) pH and conductivity (σcond.); (g) Mg2+ and K+; and (h) NH4 +with F-. Cell abundance, Cl-, NO3 -, pH, Mg2 +, and NH4 + are given as closed circles, while Ca2+, Na+, SO4 2-, σcond., K+, and F-are given as open circles. Error bars indicate standard deviations. The shaded area between 24 and 26 June indicates samples where the abundance of mineral dust particles (MPs) exceeded the cell counts according to categories 3 and 4 in . Symbols without error estimates indicate single measurements. Dates are given as yyyy-mm-dd.
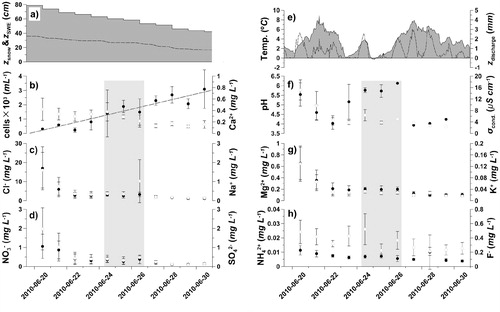
TABLE 3 Concentrations and total loads of the snowpack at the start of the elution study (based on the z SWE weighted layering of the snow profile, , n = 1), and at the end (n = 6) of the survey in 2010.
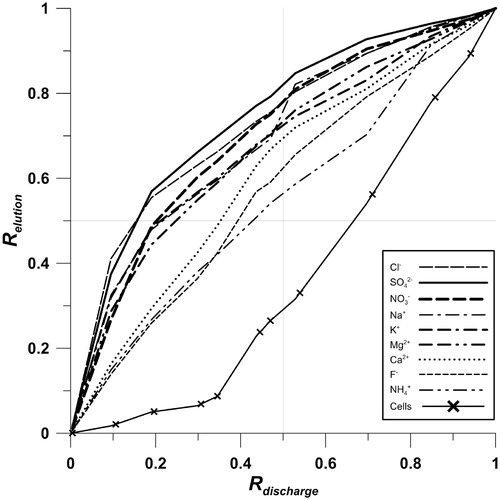
FIGURE 5. Preferential elution of major ions and cells given as a ratio of the total accumulated elution (R elution) in comparison to the ratio of total accumulated meltwater discharge (R discharge).