Figures & data
TABLE 1 Mycorrhizal and functional types of the studied plant species.
TABLE 2 Results of nested ANOVA (species are nested in functional type) for nitrogen concentration and δ15N.
TABLE 3 Leaf N concentration and δ15N for studied alpine species from different functional types (see for abbreviations).
FIGURE 1. Leaf N concentration for different functional types of alpine plants (mean and standard error) (see for abbreviations). Significant (p < 0.05) differences are shown by different letters.
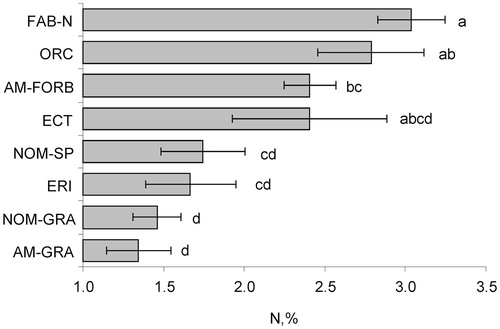
FIGURE 2. Leaf N concentration and δ15N for 3 nitrogen fixing and one non-fixing (Trifolium polyphyllum) legumes in the alpine lichen heath. Significant (p < 0.05) differences are shown by different letters.
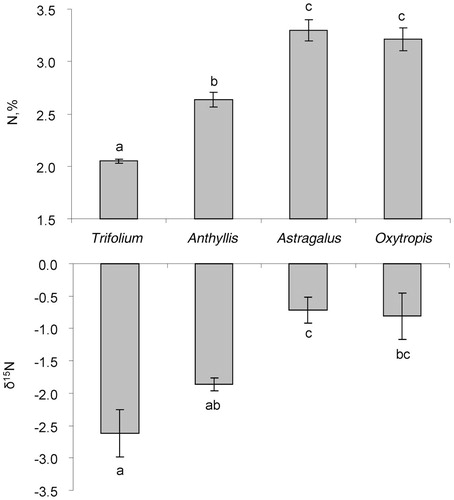
FIGURE 3. Relationship between N leaf concentration and rate of mycorrhizal infection (%) for 6 arbuscular mycorrhizal (AM) plant species.
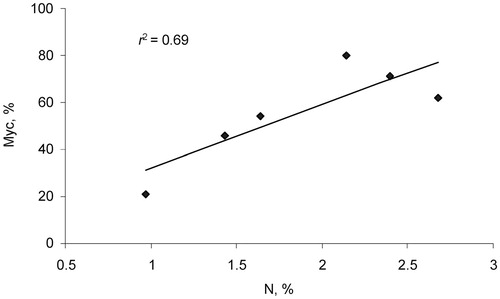
FIGURE 4. δ15N for different functional types of alpine plants (mean and standard error) (see for abbreviations). Significant (p < 0.05) differences are shown by different letters.
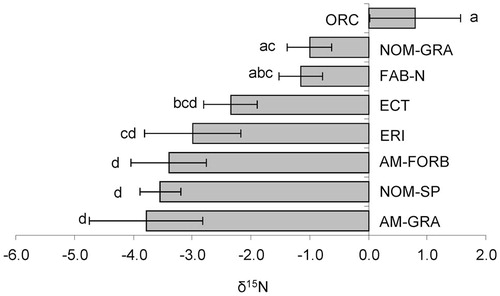
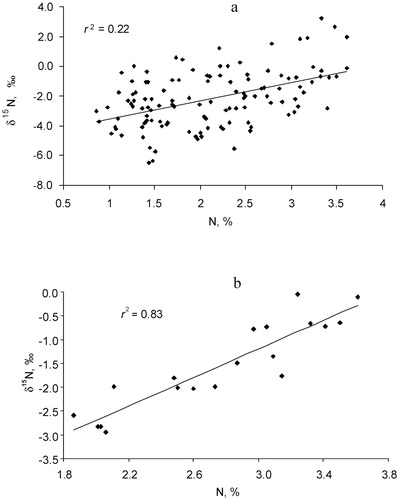
FIGURE 5. Relationships between N concentration and δ15N in alpine plants: (a) all species; (b) legume species.