Figures & data
FIGURE 1. Lake Waiau Study Area. 3 cm digital elevation model (DEM) with orthomosaic overlay.
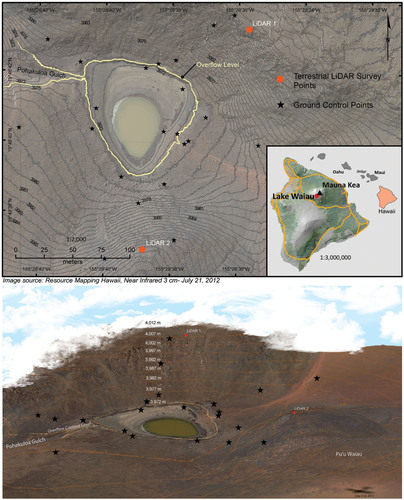
FIGURE 2. Camera positions for structure from motion (SfM) data processing. (A) Camera positions for terrestrial photography SfM DEM generation. (B) Camera positions for aerial photography SfM DEM generation.
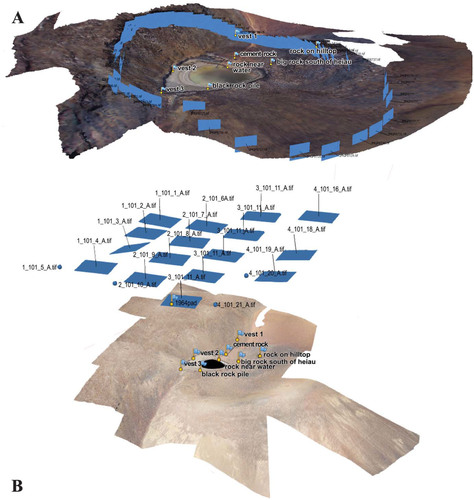
FIGURE 3. Hillshade comparison of DEM data sets. Lake Waiau is the white area in the center of each hillshade and varies in size with date the data was acquired. Contour interval is 1 m. (A) Terrestrial Light Detection and Ranging Systems (LiDAR), 12 June 2012, 3 cm resolution. (B) SfM terrestrial photography, 14 June 2012, 3 cm resolution. (C) SfM terrestrial photography, 19 July 2012, 3 cm resolution. (D) Aerial photography, 9 September 1995, 1 m resolution.
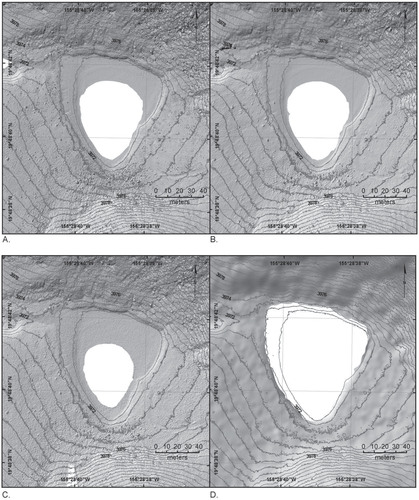
FIGURE 4. Point cloud comparison between the different data collection methods used. (A) Aerial SfM to terrestrial laser scanning (TLS). (B) Terrestrial SfM to aerial SfM. (C) Terrestrial SfM to TLS.
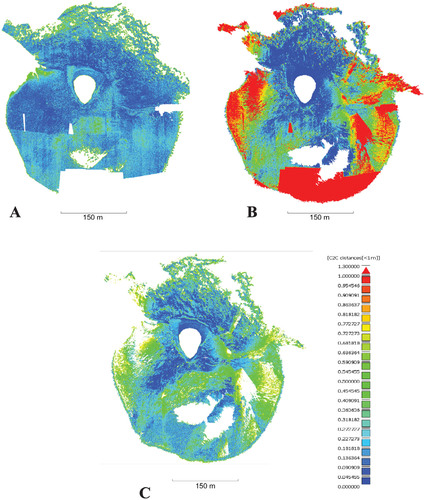
FIGURE 5. DEM fusion of terrestrial LiDAR and sonar lake bathymetry. Lake levels from selected months in 2012 are orange. The overflow level is shown in yellow, and the October 1978 drought level is highlighted in green.
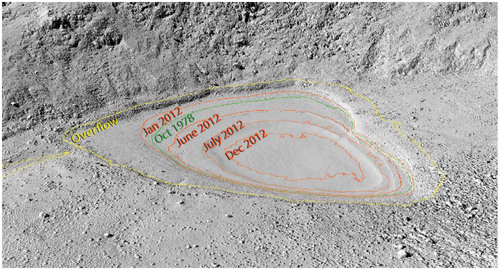
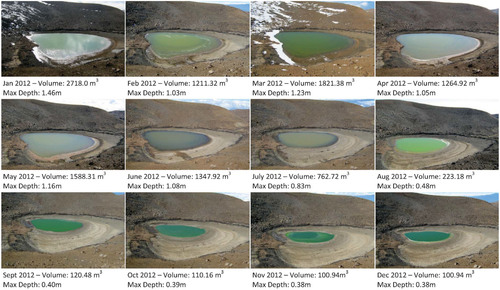
FIGURE 6. Lake Waiau level fluctuations from January 2012 to December 2012. Photography courtesy of the Hawaii Department of Land and Natural Resources, Division of Forestry and Wildlife, Natural Areas Reserve System and the Office of Mauna Kea Management.