
Figures & data
FIGURE 1. Time series of summit precipitation (mm) from listed weather stations and average daily temperature (°C, in red) from the United Kingdom Infra-Red Telescope (UKIRT) for (a) 2008, and (b) 2009.
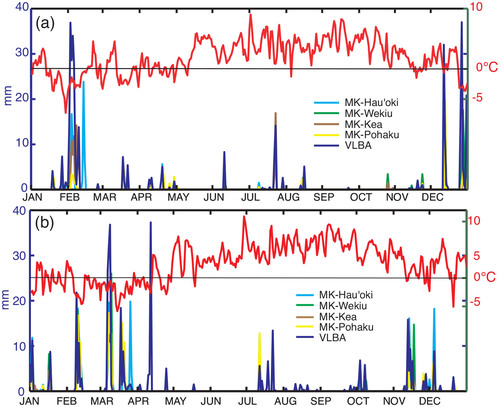
FIGURE 2. Study area spans from 19.808°N to 19.837°N and -155.495°W to -155.455°W, a 140,400 m2 area. Plotted are locations of Davis weather stations (red) and telescope weather stations (blue). See for locations and definitions of acronyms.
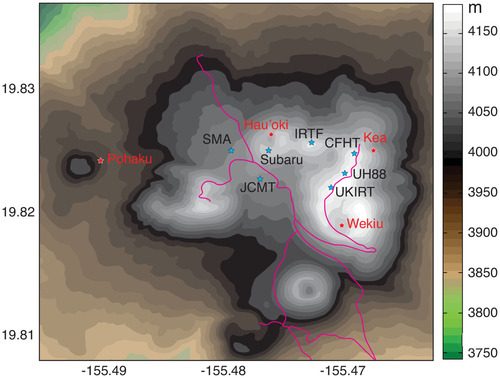
TABLE 1 Weather stations and their locations, elevations, recorded variables, and valid dates for this study.
TABLE 2 Pu'us within the study area, listed from east to west from their centers.
FIGURE 3. Key features of the snow-transport model (after CitationListon et al., 2007).
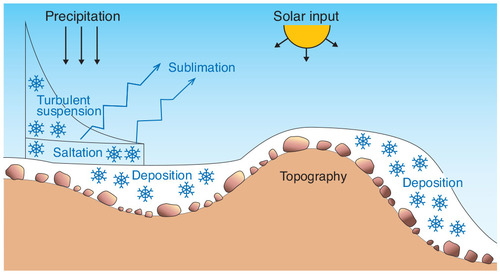
FIGURE 4. Field experiment on 11 JANUARY 2011; (a) Pu‘u Hau'oki during field experiment, taking snow depth measurements (Photo by C.R.S. Chambers); (b) ruler showing depth in cm (Photo by L. Eaton).
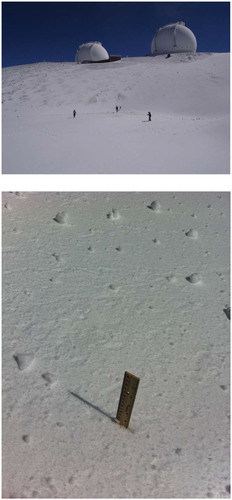
FIGURE 5. Mauna Kea summit (a) average hourly temperatures, and (b) average daily wind speed for 8–14 January 2011. (c) Precipitation time series for 12 UTC 09 January to 2300 UTC 11 JANUARY 2011. (d) Wind rose plot of Mauna Kea summit wind speeds and directions from 1000 UTC 09 January to 0900 UTC 11 JANUARY 2011. See for definitions of site acronyms in the graph and for their relative locations.
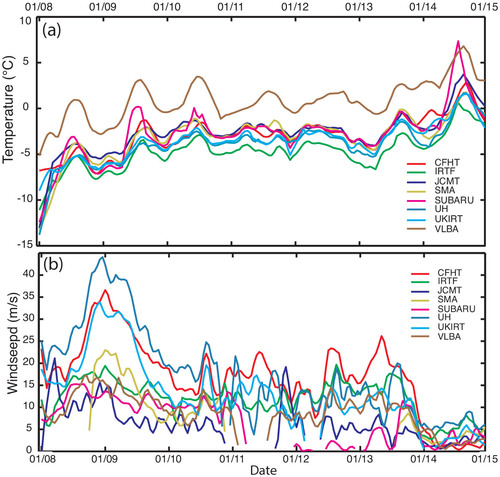
FIGURE 5. continued Mauna Kea summit c) Precipitation from 1200 UTC 09 January to 2300 UTC 11 JANUARY 2011. d) Wind rose plot of Mauna Kea summit wind speeds and directions from 1000 UTC 09 January to 0900 UTC 11 JANUARY 2011.
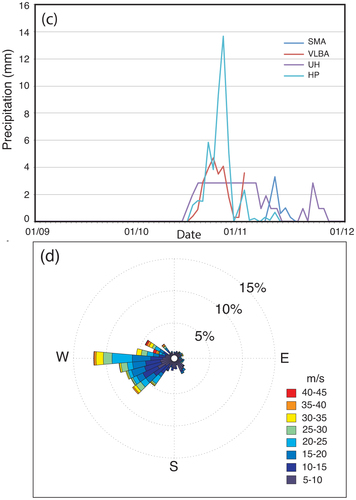
FIGURE 6. (a) Pu‘u Hau'oki, and (b) Pu‘u Wēkiu modeled snow depth (color contours in m) for 0959 UTC 11 January 2011; snow depth observations (colored dots) between 2130 UTC 11 January and 0000 UTC 12 January 2011.
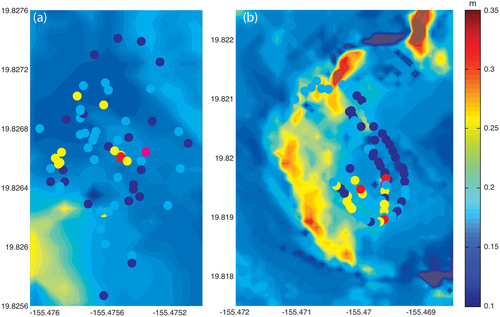
FIGURE 7. Wind rose of winds during snow events only for (a) 2008 and (b) 2009.
FIGURE 8. Wind rose for all Mauna Kea summit winds for January 2008 through December 2010.
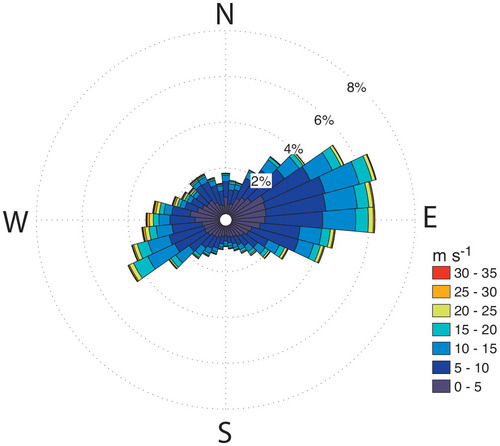
FIGURE 9. Modeled wind speed (m s-1) from cardinal wind fields: (a) east, (b) west.
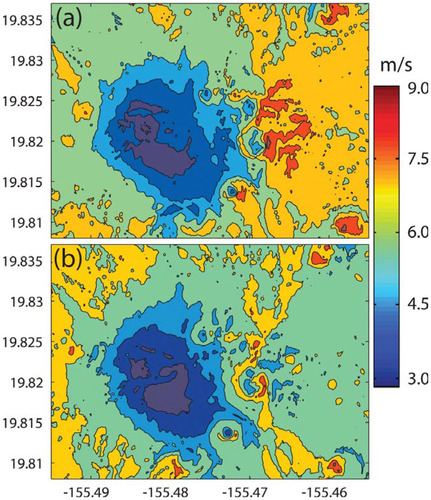
FIGURE 10. Modeled wind direction from cardinal wind fields: (a) east (90), (b) west (270).
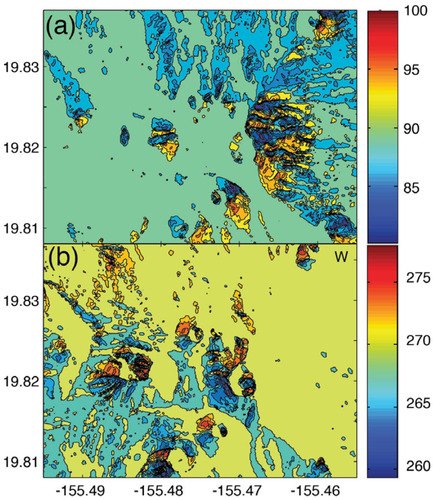
FIGURE 11. Modeled snow depth (in meters, shading) and elevation (white contours) of Mauna Kea summit for the 2-year total from 2008 to 2009, and Wēkiu Bug trap locations from 2002 to 2008 with positive capture rates (yellow boxes), locations with extended subfreezing temperatures (white circles). Red lines indicate roads and dark shading indicates areas of lava flows and glacial till found to be unsuitable as Wēkiu bug habitat (Lockwood, 2000).
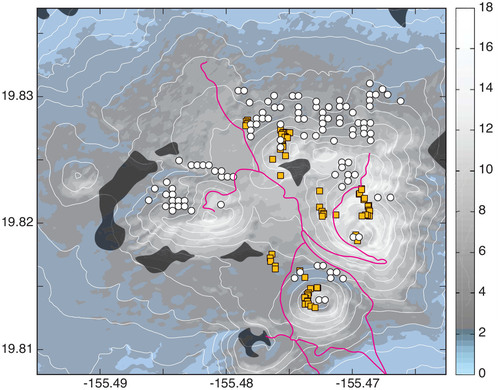
FIGURE 12. As in , but for modeled bug fall density (undefined relative scale, colored shading) on Mauna Kea for 3-year total from 2008 through 2010.
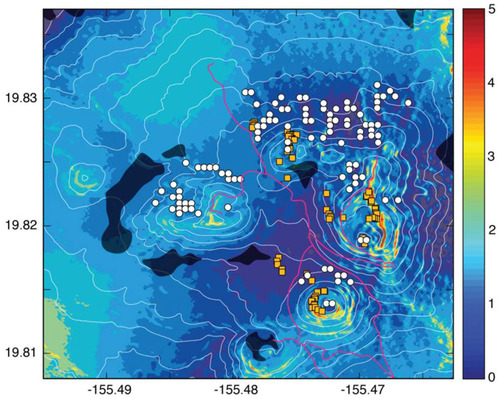
FIGURE 13. Same as , but with elevation contours in red, but for (a) Pu‘u Haukea; (b) Pu‘u Pōhaku and Pu‘u Poli'ahu; and (c) Pu‘u Hau'oki and Pu‘u Wēkiu.
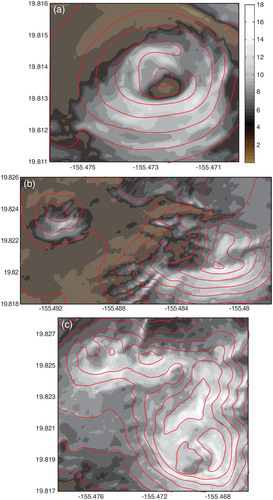
FIGURE 14. Same as , but for (a) Pu‘u Haukea; (b) Pu‘u Pōhaku and Pu‘u Poli'ahu; and (c) Pu‘u Hau'oki and Pu‘u Wēkiu.
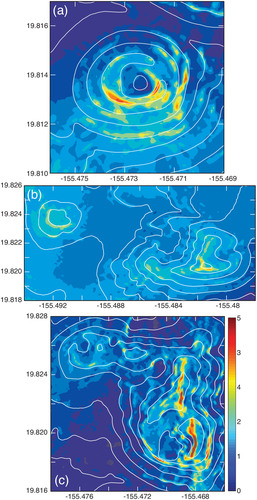
TABLE 3 Summary of 2004–2011 Wēkiu bug expeditions conducted on Mauna Kea under the Hawaii Biological Survey.