Figures & data
FIGURE 1. (a) Afternoon clouds capped by the trade wind inversion on the windward slopes of the Cordillera Central, Dominican Republic. The base of the inversion blocks cloud formation below a roughly constant elevation. The forest in the foreground is comprised entirely of a single species, the endemic Pinus occidentalis Swartz. The photo was taken above the inversion at ∼2600 m elevation in January 2007. (b) A HOBO unit in the field at 2765 m elevation, showing the configuration and the radiation shield used throughout the study.
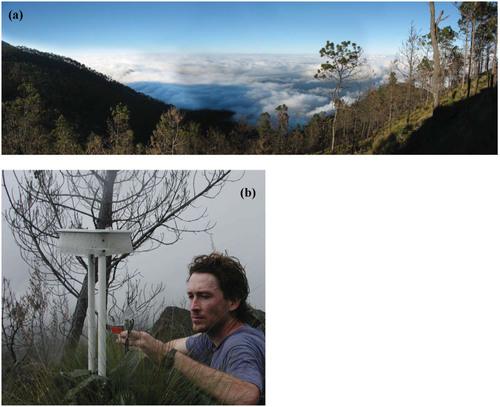
FIGURE 2. Map of the study area, weather station locations, the pine-cloud forest ecotone, and extent of monodominant pine forest in the Cordillera Central, Dominican Republic. The direction of the prevailing trade winds is shown with the black arrow. Monodominant pine forest extend was delineated with a photomosaic constructed from georeferenced aerial photographs taken in 1999 (CitationMartin et al., 2007).
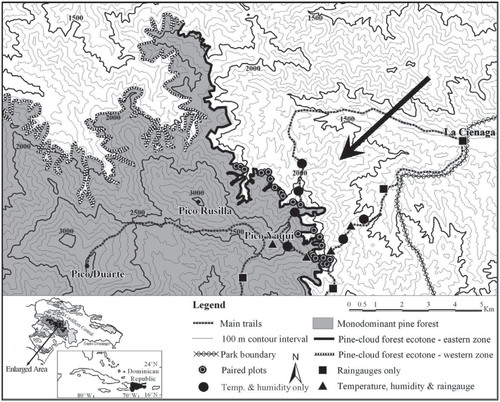
FIGURE 3. Climate patterns by elevation in the Cordillera Central, Dominican Republic. All data are windward locations except where noted. (a) Mean temperature: annual, January (coldest) and July (hottest) temperatures; (b) annual patterns in mean monthly precipitation and mean monthly precipitation in the dry season (January–March) at windward and leeward locations; (c) mean relative humidity: annual, January, July, and dry season (January–March); (d) Frequency of cloud occurrence (determined by the frequency of relative humidities ≥ 95%) annually, in January, July, and the dry season (January–March).
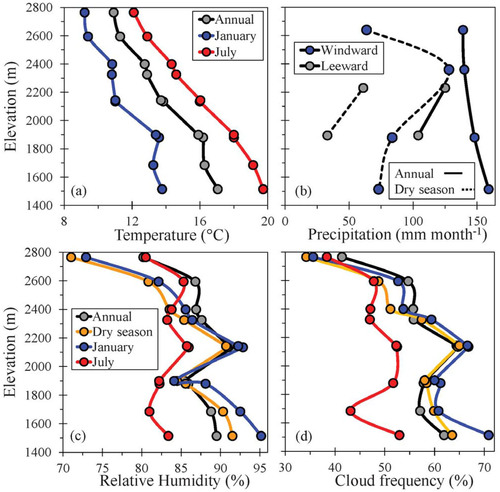
FIGURE 4. Mean monthly temperature and mean monthly night temperature (from 7 p.m. to 7 a.m. local time) by elevation on the windward slopes of the Cordillera Central, Dominican Republic.
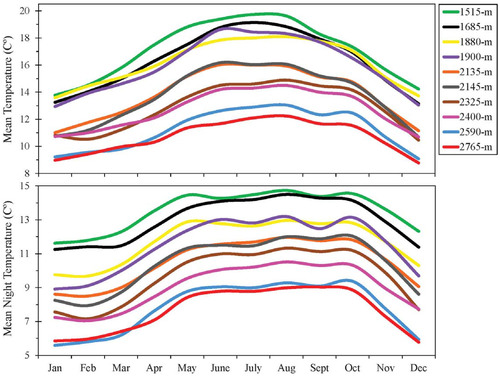
FIGURE 5. Daily development of temperature and humidity profiles by elevation on the windward slopes of the Cordillera Central, Dominican Republic. A single day is shown (15 January 2008) when the trade wind inversion (TWI) was present. Blue lines are the morning hours, red lines are afternoon hours, and black lines are nighttime hours. Two inversions develop during the day, one set by ambient TWI conditions and the other by diurnal surface heating and convection. Nighttime hours isolate the influence of the TWI most clearly at 2400–2500 m, as daytime influences are not present.
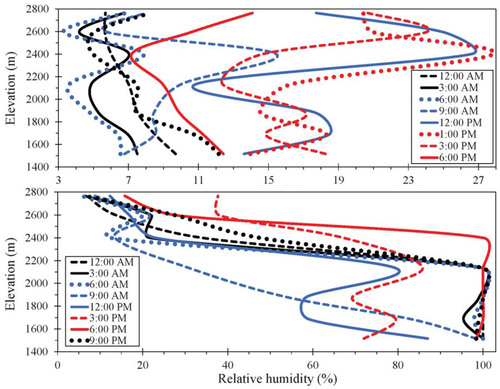
FIGURE 6. Seasonal patterns by elevation in (a) mean daily temperature at 3 p.m. local time, (b) mean daily relative humidity at 3 p.m., (c) mean daily temperature at 3 a.m., and (d) mean daily relative humidity at 3 a.m. Seasons were as follows: Winter: December-February; Spring: March–May; Summer: June–August; Autumn: September–November; Dry Season: January–March.
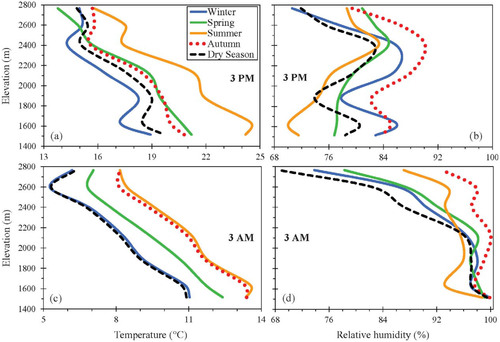
FIGURE 7. Seasonal patterns in mean monthly relative humidity by elevation on the windward slopes of the Cordillera Central, Dominican Republic.
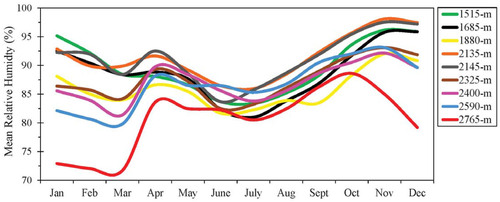
FIGURE 8. Annual frequency of freezing and near-freezing air temperatures by elevation on the windward slopes of the Cordillera Central, Dominican Republic. Temperatures were measured every 30 min at 1 m above the ground. Frequencies of measurements below a threshold (e.g., <2 °C ) include all temperatures recorded below that threshold, and so are inclusive of the lower thresholds. A day was only counted once even if it experienced temperatures below a given threshold repeatedly throughout that day.
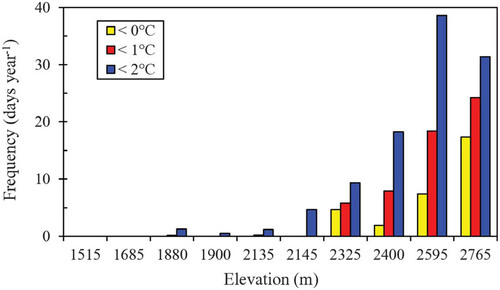
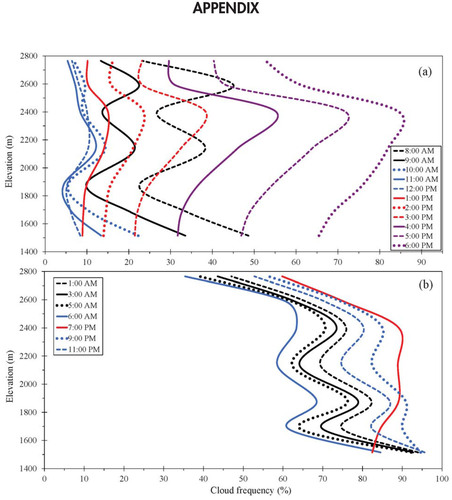
FIGURE A1. Mean frequency of cloud occurrence (indexed by the frequency of relative humidities ≥ 95%) by elevation and hour of the day. Panel (a) shows daytime hours and panel (b) nighttime hours. Values of ≥ 95% relative humidity do not indicate clouds categorically occurred, especially after sunset when dropping temperatures can result in high relative humidities and dew formation. However, during the daytime this threshold is a much more reliable index of cloud formation as temperatures are generally high enough to keep relative humidity below 95% in areas free of clouds. These patterns include all climatic conditions that occurred at an elevation over the entire period of measurement, including conditions that reduce or eliminate the elevational signal in cloud formation patterns (e.g. frontal storms, periods without the TWI, seasonal influences). Despite these influences, strong elevational patterns are evident in the daytime frequency of cloud formation. In particular, cloud development during the day is notably high at 2400 m; by 4:00 p.m.; clouds develop daily more than 55% of the year at this elevation while occurring less than 31% of the year just 200 m higher. This translates into ∼3 months of additional cloud formation at 2400 m than 2590 m. We expect these elevational patterns would be even stronger if we only compared clear, sunny days when the TWI was present, but this data is not available.