Figures & data
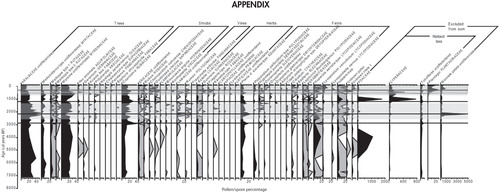
FIGURE 1. (a) Regional location of the study site on Haleakalā volcano, on the Hawaiian Island of Maui. (b) Location of Wai'ānapanapa within the northeast rift zone at high elevation on windward Haleakalā, with easting in meters from the UTM coordinate system (NAD83, UTM Zone 4).
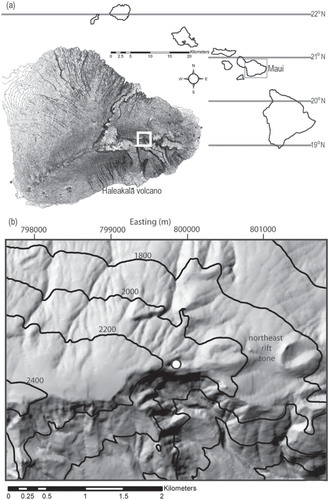
FIGURE 2. (a) Photograph of Wai'ānapanapa showing its position relative to the upper limit of cloud forest and (b) the dense cloud forest that surrounds the lake basin. Photo by Gregor Schuurman.
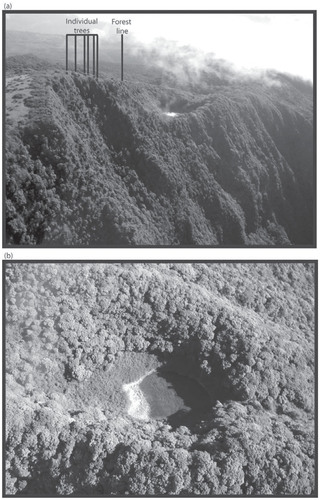
TABLE 1 Accelerator mass spectrometry 14C ages from a sediment sequence from Wai'ānapanapa on the Hawaiian Island of Maui.
FIGURE 3. Age-depth model for Wai'ānapanapa at 2103 m on windward Haleakalā. Width of the color bands describes the degree of uncertainty in the model. Two shades of gray meet at the site of a slump, ∼1850 cal yr BP, which was removed from the age-depth model. Models were created with OxCal v4.1.7 (CitationBronk Ramsey, 2009).
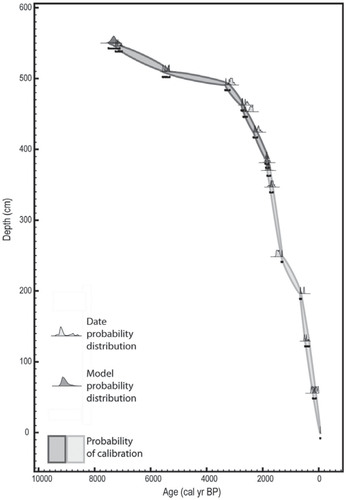
FIGURE 4. Changes over time in (a) axis 1, and (b) axis 2 of a non-metric multidimensional scaling (NMS) ordination of pollen/spore assemblages from Wai'ānapanapa, which sit at the modern mean trade-wind inversion (TWI) on windward Haleakalā, Maui. In graphs a-b, the species composition group to which each sample is assigned is shown; gray circles = cluster group 1, white triangles = cluster group 2, black triangles = cluster group 3, and black squares = cluster group 4 (see , part d). (c) Average chain length (ACL) from leaf waxes over time from Wai'ānapanapa. A horizontal line is drawn at the surface sediment sample with ACL = 28.07. Samples above this line (lower ACL) suggest more pubescent M. polymorpha and a drier site, with a lower-elevation TWI; samples below the line (higher ACL) suggest more glabrous M. polymorpha and a wetter site, with a higher-elevation TWI. Time periods with increased drought frequency are shown with a gray background, in regions of the ACL paleorecord with repeated samples of ACL lower than the modern surface sample, and (d) charcoal accumulation rates from Wai'ānapanapa, with samples interpolated to 2.5-year intervals. Fires that meet the 99.9% threshold are indicated with vertical lines. Time of decreased fire return interval is highlighted with a hachured background.
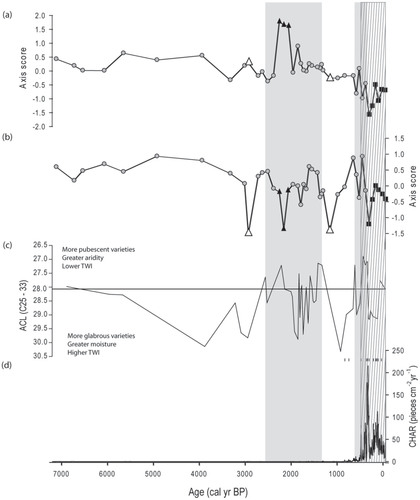
FIGURE 5. The two most important axes of a non-metric multidimensional scaling ordination of pollen assemblages from Wai'ānapanapa on east Maui, which show samples with evidence of (a) drought, (b) fire, and (c) dieback. (d) shows four species composition groups defined by a stratigraphically unconstrained cluster analysis (MRPP, A = 0.20, P = 0; also see , parts a and b) with polygons surrounding the three disturbance types. Axis 1 explains 54.5% of the variation in species composition, and axis 2 explains 27.8% (axis 3, not shown, explains 10.9%).
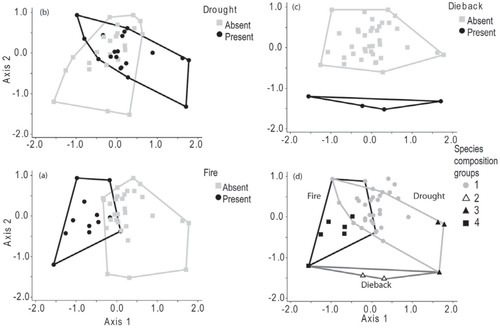
TABLE 2 Indicator species analysis showing pollen and spore types that are significantly (P < 0.05) more (+) or less (-) frequent/abundant in samples associated with each disturbance type. Pollen/spore assemblages are from a 7300 cal. yr BP record from Wai'ānapanapa near the upper limit of cloud forest on the Hawaiian Island of Maui.
FIGURE A1. Pollen percentages over time from Wai‘ānapanapa at 2103 m on windward Haleakalā, east Maui. Exaggeration curves of 10% are shown in gray, and pollen types that never exceed 0.5% are shown as dots. Disturbance regimes are highlighted in horizontal bands; drought is gray, fire is hachured, and dieback events are horizontal black lines.