Figures & data
FIGURE 1. (A) Location, (B) warming equipment installation, and (C)plots distribution of the experimental site.
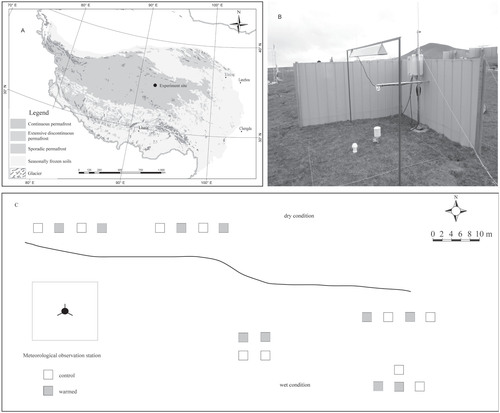
TABLE 1 Soil pH, CaCO3 (g kg-2), soil organic carbon (SOC, g kg-2), total nitrogen (TN, g kg-2), inorganic nitrogen (IN, mg kg-2), and bulk density (BD, g cm-3) in the 0–20 cm, and plant coverage (Cov., %) and height (H, cm) in the dry and wet conditions
FIGURE 2. (A) Mean soil temperature (°C, 5 cm) and (B) soil moisture (v/v%, 0–10 and 60–100 cmb) from 1 October 2010 to 18 July 2013 in dry and wet conditions. Different labels above columns represent significant difference between control and warming. (P < 0.05).
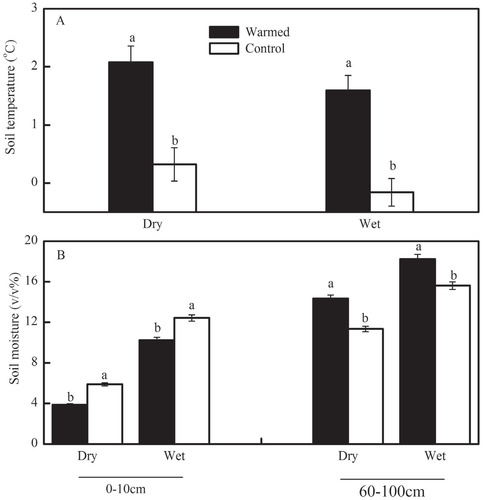
FIGURE 3. Relationship of soil respiration (R s µ mol m-2 s-1) and its components (R a and R h) with soil temperature (°C, 5 cm) and soil moisture (v/v%, 10 cm) in wet (filled circles and solid lines) and dry conditions (open circles and dashed lines).
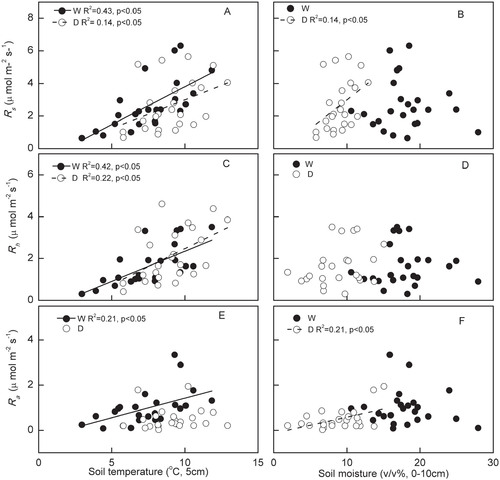
FIGURE 4. Seasonal dynamic of soil respiration (R s) and its components (R a and R h) in control and warming plots in dry and wet conditions. Data are averaged from replicates, n = 14. Dates are given in the form m/dd/yyyy.
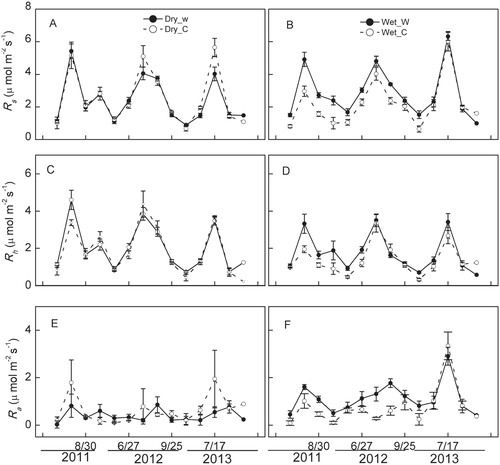
TABLE 2 Results (F-values) of split-plot variance analysis on the effects of warming, soil moisture condition, and their interaction on soil respiration (R s ) and its components (R h and Ra), aboveground biomass (AGB), and root biomass (RB).
FIGURE 5. Seasonal and average (inserted panels, mean ± SE, n = 13) warming effects on (A) soil respiration (R s), (B) heterotrophic respiration (R h), and (C) autotrophic respiration (R a) in wet (dark columns) and dry (white columns) conditions. Asterisks denote significance between warming and control treatments (** P < 0.01; * P < 0.05).
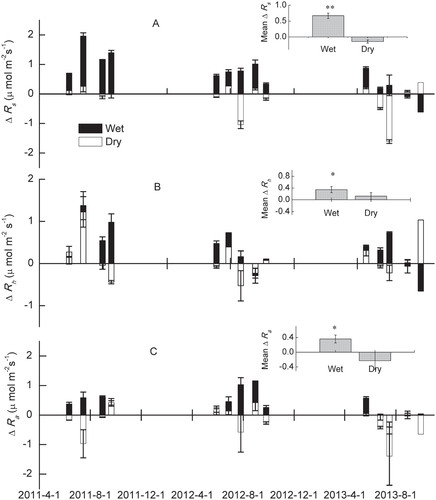
FIGURE 6. Warming effects on above-ground biomass (AGB) and root biomass (RB, 0–50 cm soil depth) in wet and dry conditions. Values are the average of four replicates in dry and six replicates in wet from May to September 2012. Different labels above columns indicate the significant difference at the P < 0.05 level.
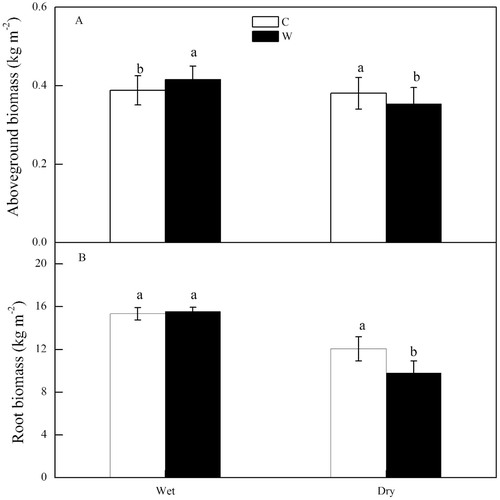
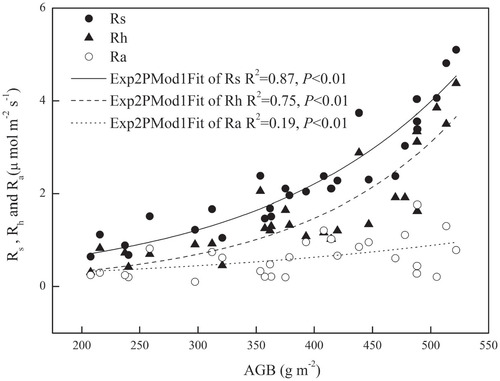
FIGURE 7. Relationship of soil respiration (R s µ mol m-2 s-1) and its components (R a and R h) with above-ground biomass (AGB) in all plots.