
Figures & data
FIGURE 1. Map showing locations of study sites Manasaya, Lower Manasaya, Sajama, and Tuni in Bolivia. Detail maps (left) are false-color Landsat 8 images, with the NIR band displayed in green to accentuate vegetation. The Tuni site is outlined to clearly demarcate its extent. Overview map (right) displays a colorized shaded relief elevation image, using data from the NASA Shuttle Radar Topography Mission.
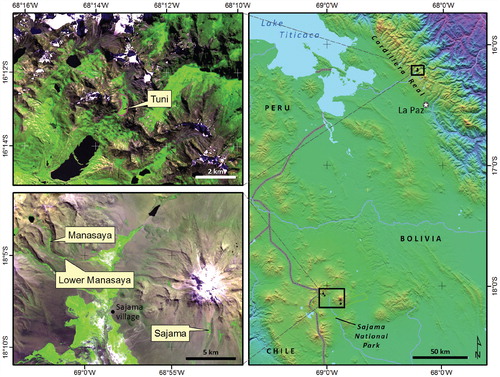
TABLE 1 Site characteristics for the four study bofedales (high mountain peatlands). Mean elevation, pH, and electrical conductivity (EC in uS) of groundwater in monitoring wells.
FIGURE 2. Distichia muscoides cushions in upper Manasaya study area, Bolivia.
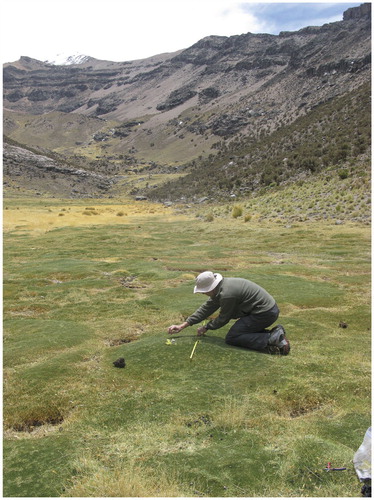
FIGURE 3. Height growth from October 2012 to April 2013, September 2013, and March 2014 for each moss wire site in the four study areas. Each symbol and line represents measurement from one site.
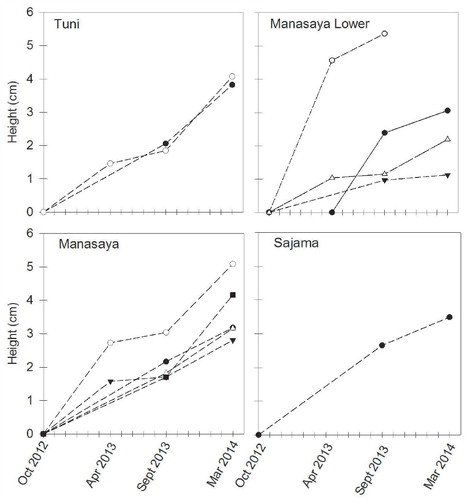
FIGURE 4. Height change (cm) for the periods October 2012—April 2013 (solid gray bar), April 2013-September 2013 (solid dark gray bar), and September 2013—March 2014 (white bar) for all study sites. Hatched areas are height change from October 2012—September 2013 (hatched gray bar) for sites that were not measured in April 2013. M = Manasaya, ML = Lower Manasaya, S = Sajama, T = Tuni. Height at each site is represented by its site code.
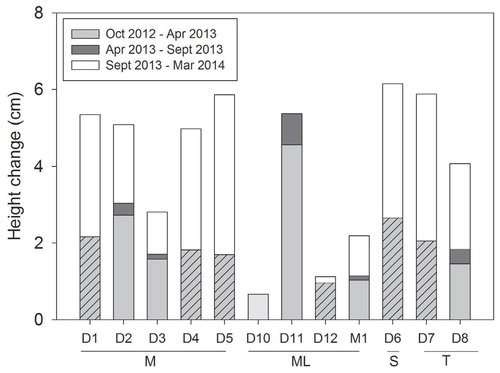
FIGURE 5. Mean organic carbon production for the four study sites Manasaya (M), Lower Manasaya (ML), Sajama (S), and Tuni (T) for the year October 2012-September 2013.
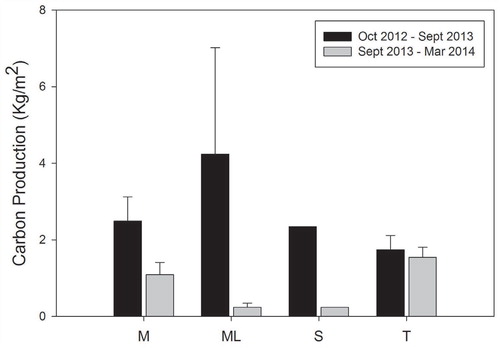
FIGURE 6. Relationship between Annual Height Increment (cm) and average water table depth (WTD) over the study period (October 2012-March 2014).
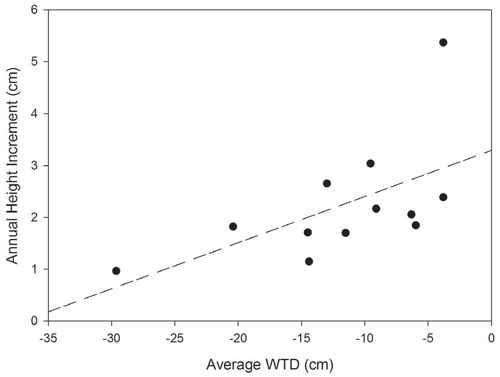
Table A1 Number of moss wires installed in each stand at the start of the experiment (Oct 2012) and the number that could be found and measured at the end of the experiment.