Figures & data
FIGURE 1. Location map of the study area. The snow cover is from IRS LISS III scene of 24 October 2005 with spatial resolution of 23.5 m. Note that elevation of Pahalgam meteorological station is 2196 m a.s.l.
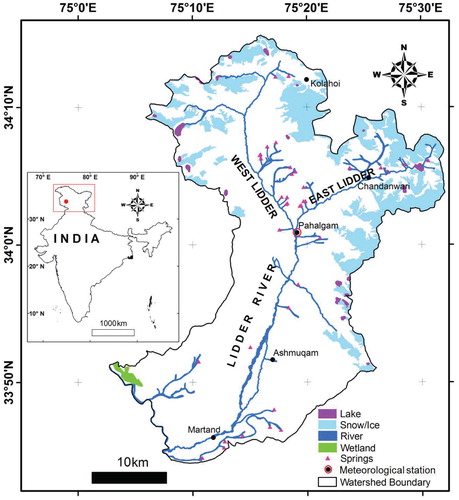
FIGURE 2. Methodology adopted for accomplishing the study.
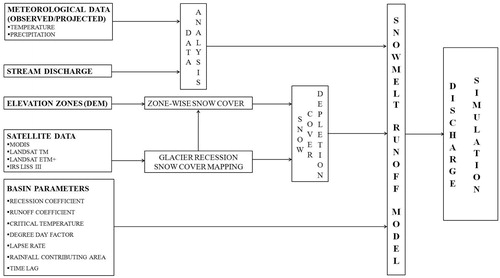
FIGURE 3. Elevation zones of the Lidder watershed.
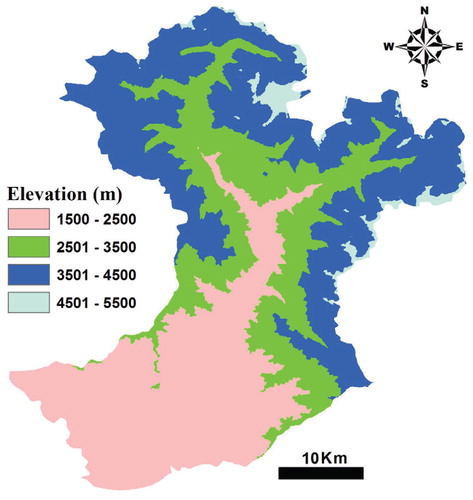
FIGURE 4. Trends in observed temperatures at Pahalgam meteorological station from 1980 to 2010. (a) Average annual temperature, (b) average minimum temperature, (c) average maximum temperature, (d) average minimum temperature in winter, (e) average maximum temperature in winter, (f) average minimum temperature in spring, (g) average maximum temperature in spring, (h) average minimum temperature in summer, (i) average maximum temperature in summer, (j) average minmum temperature in autumn, (k) average maximum temperature in autumn.
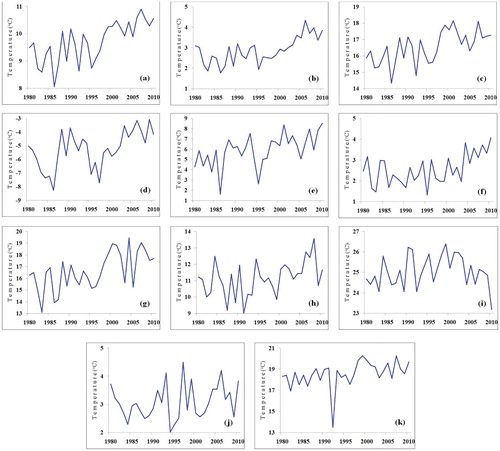
FIGURE 5. Trends in observed precipitation at Pahalgam meteorological station from 1980 to 2010. (a) Spring, (b) summer, (c) autumn, (d) winter, and (e) annual.
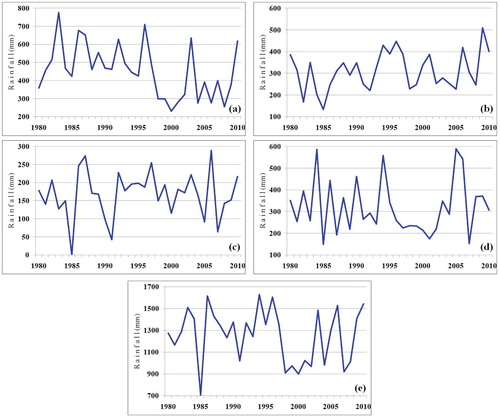
TABLE 1 Statistical analysis of average annual temperature, and average minimum and average maximum temperature at Pahalgam meteorological station.
TABLE 2 Statistical analysis of annual and seasonal precipitation at Pahalgam meteorological station.
FIGURE 6. Projected temperature and precipitation for Lidder watershed (2010–2098).
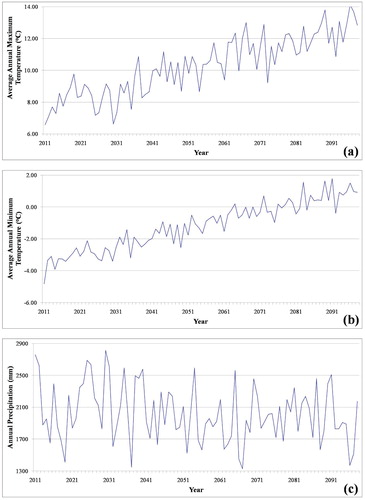
FIGURE 7. Comparison of observed temperatures from IMD and PRECIS temperature projections.
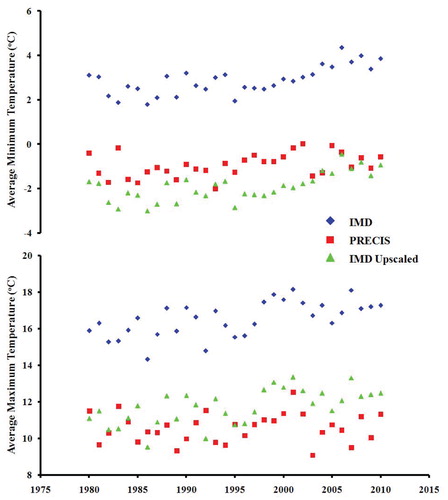
FIGURE 8. Snow depletion curves for Lidder watershed from 2003 and from 2006 to 2012.
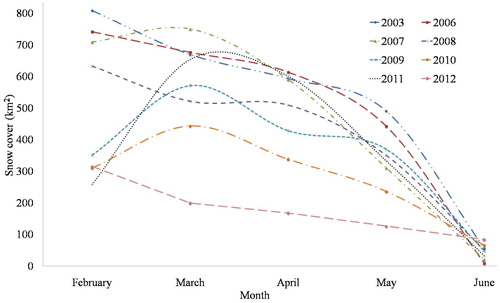
FIGURE 9. Spatio-temporal distributions of the snow cover in the study area from 2008 to 2010, in (a) February, (b) Mach, (c) April, and (d) May.
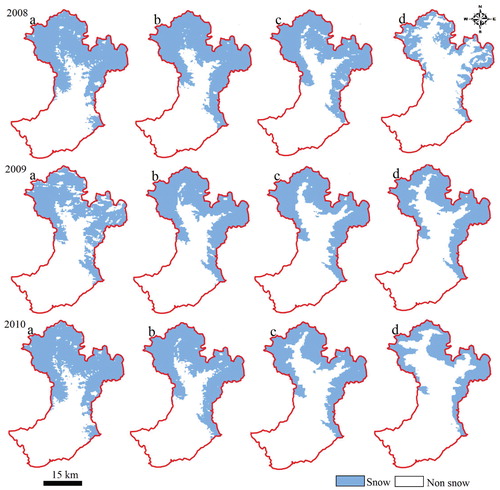
FIGURE 10. Trends in snow and rainfall during December–March, 1979–2011.
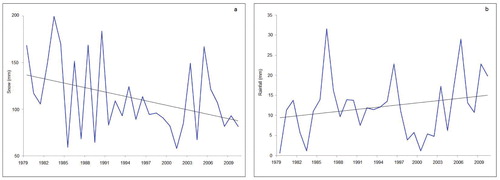
TABLE 3 Change in total glacier area of Lidder watershed and Kolahoi glacier from 1962–2013
TABLE 4 Statistical analysis of yearly and seasonal discharge at Aru, Pahalgam.
FIGURE 11. Change in spatial extent of Kolahoi glacier (1962–2013) with Landsat-8 OLI scene of 7 October 2013 in the background.
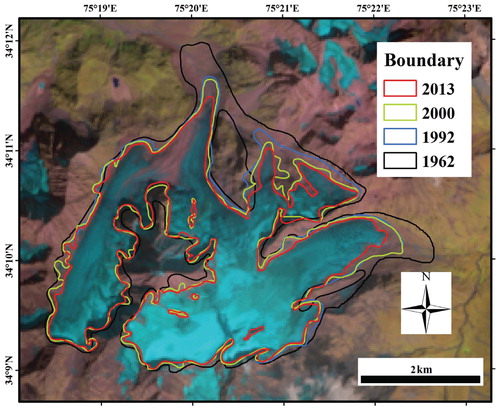
FIGURE 12. Trends in the mean annual discharge at the glacier-fed Aru gauging station, Pahalgam. Note the increasing trend in discharge from 1971 to 1994 and declining trend in discharge from 1995 to 2011.
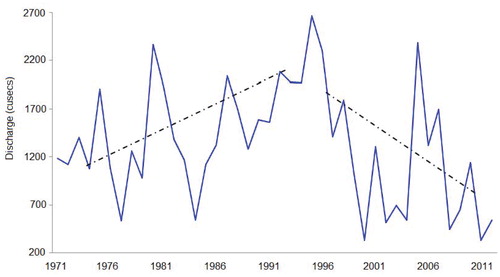
FIGURE 13. Trends in the observed discharge at Pahalgam from 1971 to 2009. (a) Discharge in spring, (b) discharge in summer, (c) discharge in autumn, (d) discharge in winter, and (e) yearly discharge.
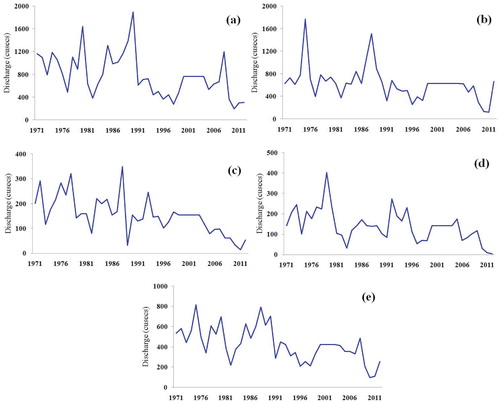
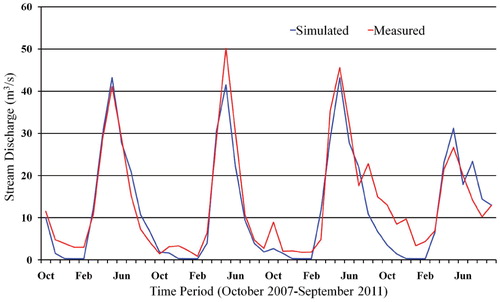
FIGURE 14. Simulated versus observed runoff using SRM model from October 2007 to September 2011.