
Figures & data
FIGURE 1. (Upper) View northeast to the crest of the Old Man Range in midwinter, showing accumulation of snow behind the snow fence, and a generally thin snow cover with a mostly icy surface in the foreground, indicating snow removal by the prevailing westerly wind. 2 July 1962. (Lower) View southwest, showing a late autumn pattern of snow-lie in the lee of the snow fence, typical of the temporary snow-lie during the nonwinter period. Note that snow has also accumulated in natural snowbanks on the leeward slope above the western side of the Fraser basin in the distance. 19 May 2005.
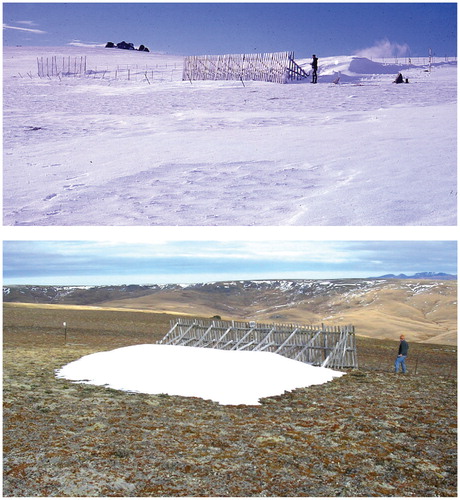
FIGURE 2. Snow depth pattern in relation to the snow fence, as recorded in May 1991 by Smith (Citation1991), shown for the smaller (30 × 20 m) study site, with 10 cm contour lines. The maximum depth is 140 cm; the minimum is <10 cm. The 3 × 2 m grid pattern, together with the contour lines, is shown on the flat image (right).
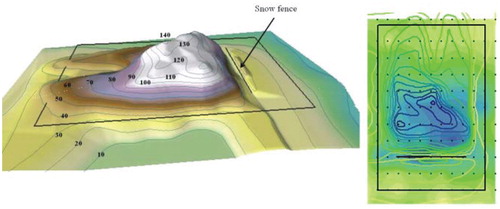
FIGURE 3. Number of days with snow cover along a transect through the center of the 20 × 30 m study site (see panel on right), based on subsurface (-1 cm) and soil (-10 cm) daily temperatures during the main snow-lie period (May–November) for two years, 2003 (above) and 2004 (below).
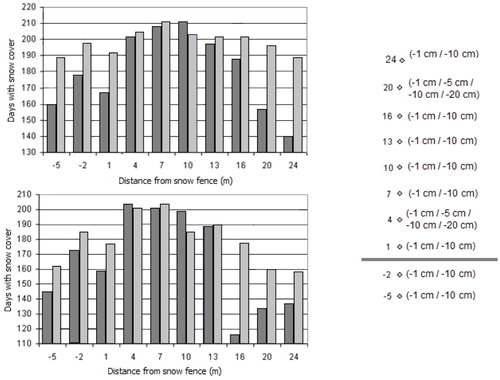
FIGURE 4. Sampling plan for (A) the larger (30 × 50 m) study site with 100 quadrat sites in a stratified random pattern, as used in 1991 and 2002, and (B) the smaller (20 × 30 m) study site with 100 quadrats (B), also distributed in a stratified random pattern, in relation to location of the snow fence (lower center) as used in 2003 and 2011.
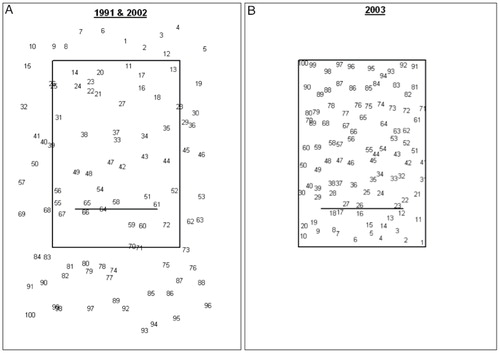
FIGURE 5. Changes in alpine plant community patterns on the 20 × 30 m study site from 1991 to 2011, in relation to the snow fence, with an angle slightly to the north, consistent with the pattern of snow-lie (see ). Note that the density of sampling increased between the 2002 and 2003 sampling and the site was extended 4 m along the northern boundary for the 2011 sampling. Letters indicate species grouping derived from the cluster analyses of shoot frequency data. Shading represents the communities recognized (species groups: dark = one or two snowbank communities and light = cushionfield community). See text for further details.
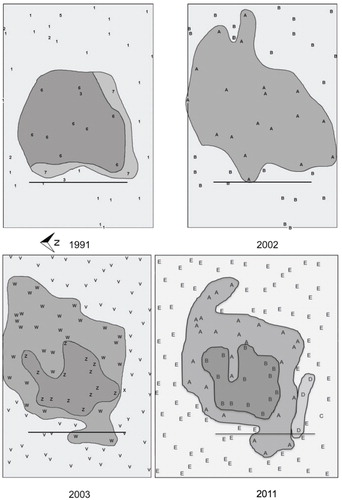
FIGURE 6. Soil temperatures at four depths (-1, -5, -10, and -20 cm) at two sites, one beyond the influence of snow accumulation associated with the snow fence (above), the other near the site of maximum snow accumulation, 4 m to leeward of the fence. Values over this 21-day period in late autumn (22 April–13 May) in 2003, show the contrasting effects between these sites in relation to snow accumulated from a fall on May 4.
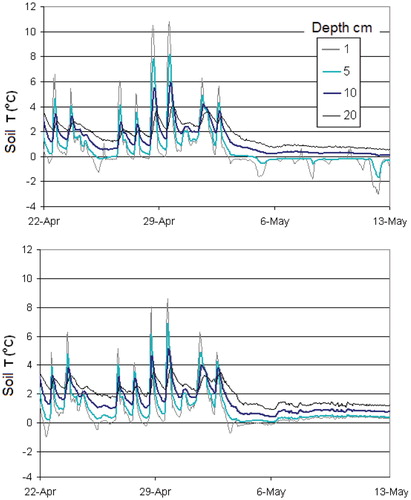
TABLE 1 Species abundance and their contributions to dissimilarity between quadrat groups (plant communities) defined from cluster analyses for 1991, 2002, and 2003. The exotic species is indicated with an asterisk.
Table
Table
TABLE 2 Mean shoot frequency of all species recorded in 120 quadrats on the study site in 2011, in relation to the five quadrat groups recognized. See for the distribution pattern of the five groups. The status of each species (increaser, decreaser, or neutral) in response to increasing snow-lie, has been indicated. Exotic species are indicated with an asterisk.
Table
TABLE 3 Results of a Spearman Rank Order Correlation between 34 plant species plus four non-plant categories, recorded with the 2003 sampling, and snow-lie pattern as recorded at the snow fence study site in 1991. The five groups recognized (A–E) range from those whose mean frequency values are strongly (A) or slightly (B) negatively correlated with snow-lie, those slightly (C) or strongly (D) positively correlated with snow-lie, and those which show no significant correlation with length of snow-lie (E). The exotic species is indicated with an asterisk.
Table
FIGURE 7. Frequency values as sampled in 2003, using 100 quadrats over the 20 × 30 m study site, showing the variation in response of eight species to differential snow-lie associated with the snow fence (also shown). The four species depicted in the top row show a negative response to the accumulation; those in the bottom row show a positive response.
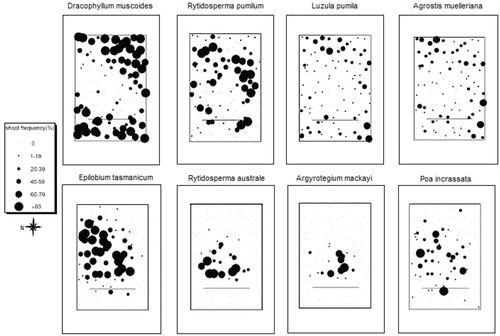
FIGURE 8. Frequency values for 12 species as sampled in 2011, using 120 quadrats over the 24 × 30 m study site (note: a 4 m strip was added on the northern side, post 2003), showing the variation in response of the same eight species as shown for 2003 () plus four additional species that show a range of responses to differential snow-lie associated with the snow fence.
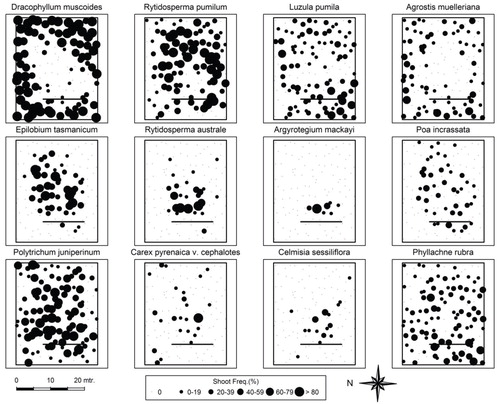
FIGURE 9. The community trait-weighted means bounded by 95% confidence intervals for each of the measured traits: (A) plant height, (B) seed mass, (C) specific leaf area (SLA), (D) leaf dry matter content (LDMC), and (E) leaf nitrogen, across the three snowmelt zones: Out, adjacent to the snow fence and beyond its influence; mid, within the influence of the snow fence; and late, in the center of the snow patch.
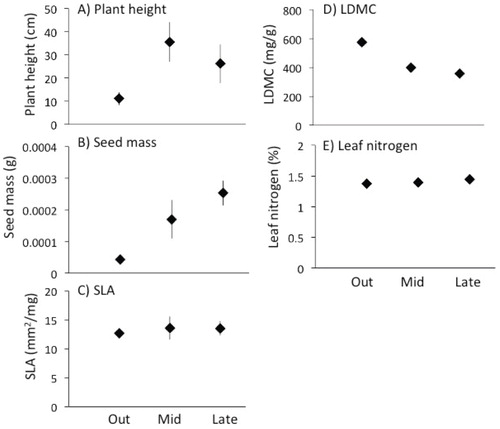
FIGURE 10. The modeled probability of occurrence of species with relatively higher SLA as well as species life form groups, in the area away from the influence of the snow zone (left), or behind the fence (right). Modeled estimates are log-transformed means of abundance; bars represent 95 % confidence intervals.
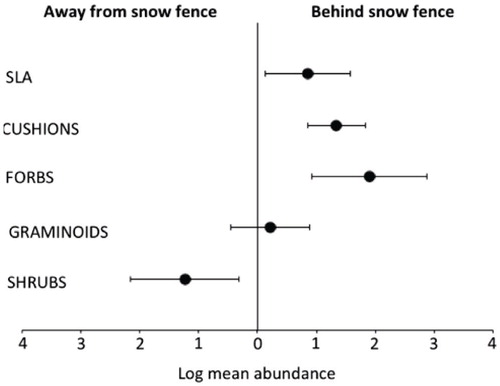
FIGURE 11. Fragment of the cushion species Colobanthus canaliculatus, collected in a trap in the lee of the snow fence. It subsequently sprouted (arrows), as shown, when moistened in a petri dish.
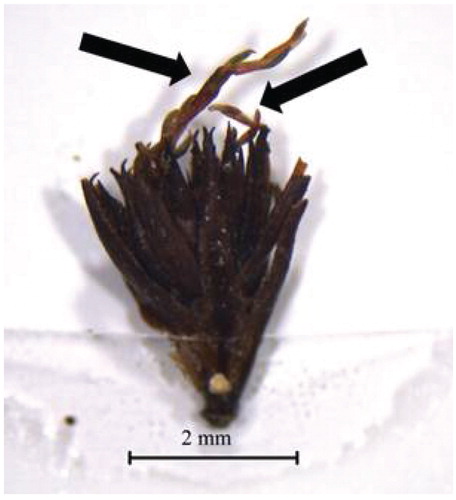
TABLE 4 Species recorded from the snow fence study site, including information about dispersal, position in relation to snow cover, and mean values for functional traits, arranged in the assumed order of their presence at the site. (A) Species listed first are those originally present and recorded on the perimeter of the site, uninfluenced by the increasing snow-lie induced by the snow fence; (B) followed by the additional species first recorded by Harrison (Citation1986b) and Smith (Citation1991); (C) then in 2002–2003 by T. Humar-Maegli (personal communication); and (D) most recently by Guevara (Citation2012). (E) Species previously recorded from natural snowbanks on the Range (CitationMark and Bliss, 1970; CitationKorsten, 2011; CitationGuevara, 2012; CitationMark, 2012), but not yet established on the snow fence study site are listed last. Out, Mid, and Center refer to the three zones recorded in 2003 (V, W, and Z in ), for which frequency values subsequently recorded by S. CitationVenn in 2011 (personal communication) are presented. Aspects relevant to the ecology of the species are given, where available, including dispersal codes (see footnote); SLA = specific leaf area; LDMC = leaf dry matter content. * = exotic species.
Table
Table