
Figures & data
FIGURE 1. Location of the long alpine lake Bangong (LBG) and the water sampling sites, including precipitation, lake, river, subterranean lake profile water sampling, and three periodical spatial lake sampling sites.The yellow solid square indicates the long-term lake sampling site, the purple solid triangles are river sampling sites, the open orange diamonds are the vertical lake profile sampling sites, the light green five-pointed star, the green square, and the pink solid circles indicate the years in which the spatial lake water was sampled (2010, 2011, and 2012, respectively).
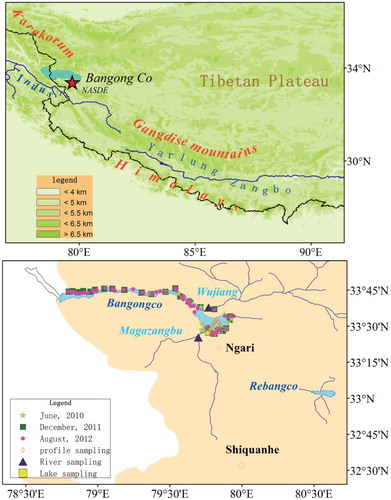
TABLE 1 Summary of sampling and isotope values (±1σ) for precipitation, underground water, and lake water in situ sampling and vertical lake water sampling at long alpine lake Bangong (LBG) Basin from 2009 to 2011
FIGURE 2. A simple schema of a gradual evaporation (E) model from east to west for the LBG.
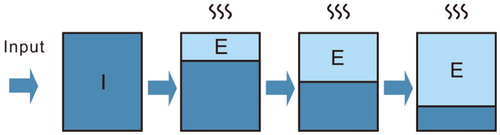
FIGURE 3. Temporal variation in the water δ18O in the LBG Basin, for (a) daily precipitation δ18O and precipitation amounts at the Ngari Station 2009–2011, (b) for weekly river δ18O in the Wujiang in 2011, the Magazangbu 2010–2011, and weekly groundwater δ18O at Ngari Station; and weekly lake δ18O in 2011– 2012.
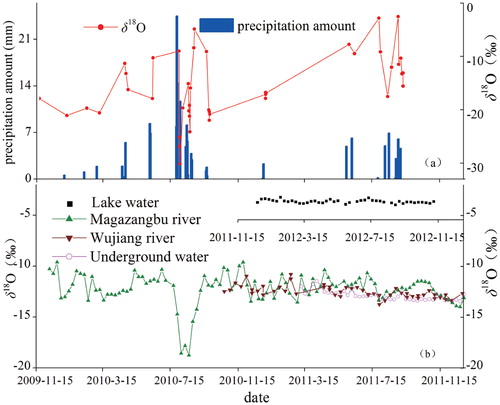
FIGURE 4. Longitudinal variations in LBG lake water (a) δ18O and (b) d-excess based on three field observations: June 2010 (red line), December 2011 (green line), and August 2012 (blue line). The shaded area shows the direct contribution of the input water from the Magazangbu River.
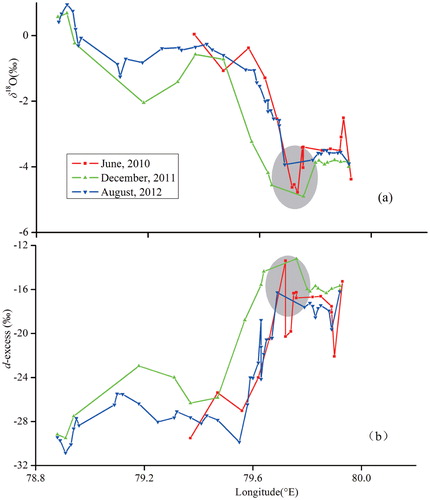
FIGURE 5. The model simulation of closed lake δ18O (solid line) and d-excess (dashed line) in lake water over time for the assumed steady state. The abscissa is for time expressed in τ, the residual time of water in a lake.
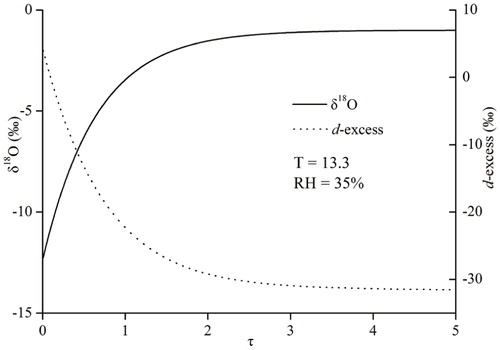
TABLE 2 Initial data for the stable isotope fractionation model.
FIGURE 6. Simulated variation of lake water (a) δ18O and (b) d-excess evolution processes in the LBG with increasing E/I ratios under present hydrometeorological conditions. The values of lake δ18O and d-excess at three sites were selected and marked on the graph: (1) at the easternmost site with a value of -5.0‰ for δ18O and -13.2‰ for d-excess, (2) at the fixed sampling site with a value of -3.6‰ for δ18O and -17.6‰ for d-excess, and (3) at the westernmost site with a value of +1.0‰ for δ18O and -30.9‰ for d-excess.
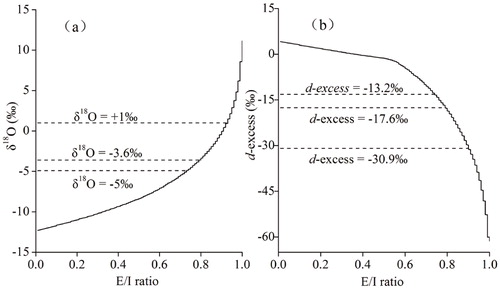
FIGURE 7. Relationship between δ18O and δD of the lake water isotopes based on field observation data (black circles) and model simulation results (gray circles). The regression line of the observed line is δD = 5.00 * δ18O - 28.48 (R2 = 0.98).The regression line of the simulation line is δD = 4.57 * δ18O - 28.06 (R2 = 1).
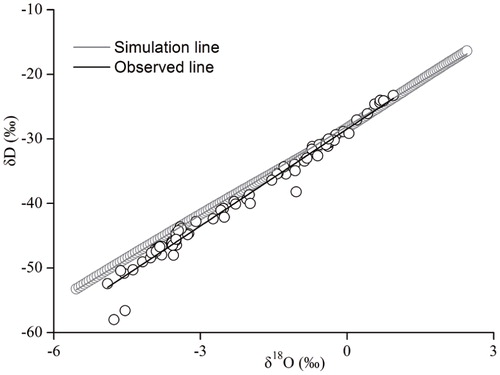
FIGURE 8. Simulated (a) δ18O and (b) d-excess evolution response to E/I ratio in the LBG, assuming various relative humidity levels; for lake water temperatures (c and d); and for initial inflow isotope value (e and f), respectively.
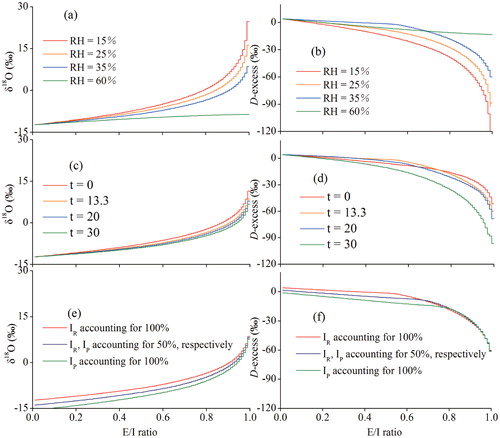
FIGURE 9. Estimation of spatial variations for the LBG for (a) lake δ18O; (b) lake d-excess, and (c) calculated E/I ratio.
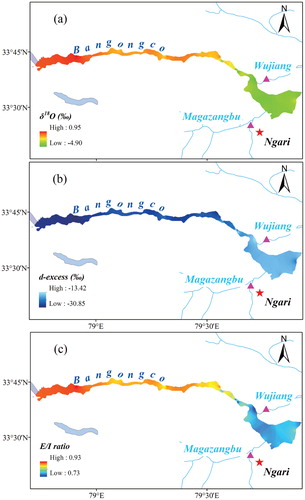
TABLE A1 Observed spatial δ18O, δD, and d—excess for the long alpine lake Bangong (LBG).
Table
Table