Figures & data
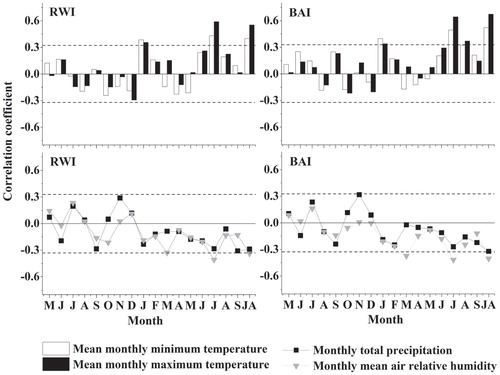
FIGURE 1. Microscopic cross section of Salix oritrepha wood.
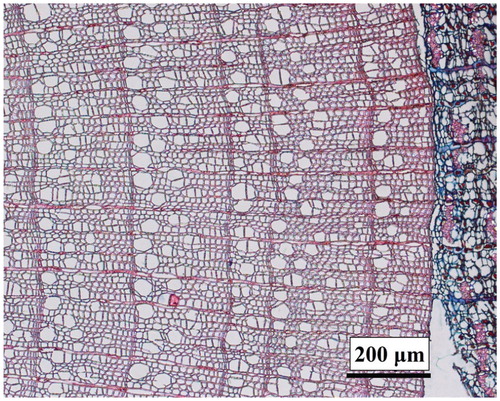
FIGURE 2. The study area and the sampling site located on the Tibetan Plateau (inset).
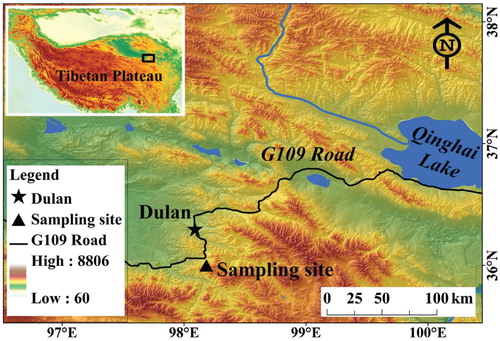
FIGURE 3. Serial sections of Salix oritrepha individual B1 showing a consistent year-to-year variability in the radial width between sections and within the same shoot. The codes indicate the name of each section. The numbers between brackets indicate the height above the ground of the sampled wood sections.
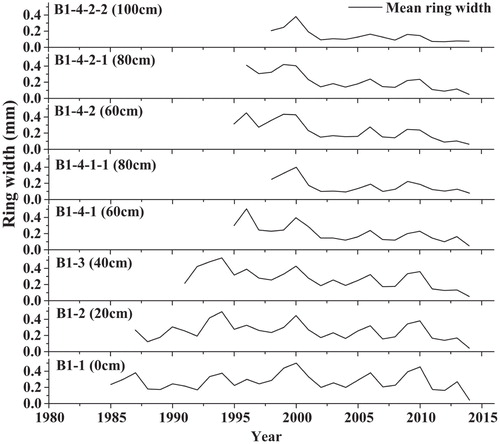
FIGURE 4. Standard chronologies of ring width (RW) and basal area increment (BAI). The first year, when the chronology is considered well replicated (Expressed Population Signal ≥ 0.85), is indicated with a vertical arrow.
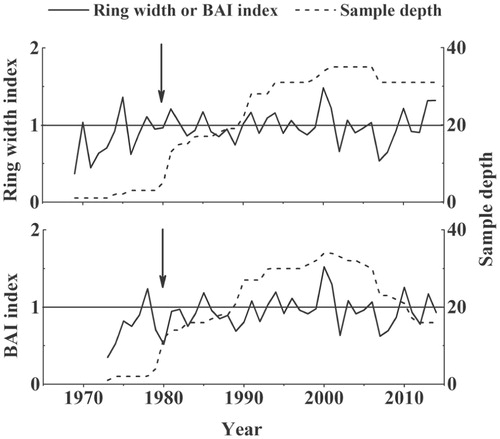
TABLE 1 Statistics of the raw measurement and standard chronologies of ring width (RW) or basal area increment (BAI).
FIGURE 5. Correlations (Pearson coefficients) calculated between the standard chronologies of ring width (RW) and basal area increment (BAI) indices and monthly climatic data (mean maximum and minimum temperatures; total precipitation, mean air relative humidity). The temporal window includes months of the previous (May to December) and current (January to September) years; that is, they are prior and concurrent to ring formation. The last code (JA) in axis x indicates the mean or summed values of July and August. The horizontal dashed lines show the 0.05 significance levels.