
Figures & data
FIGURE 1. Study sites in South Greenland marked by dots (see for further explanation).
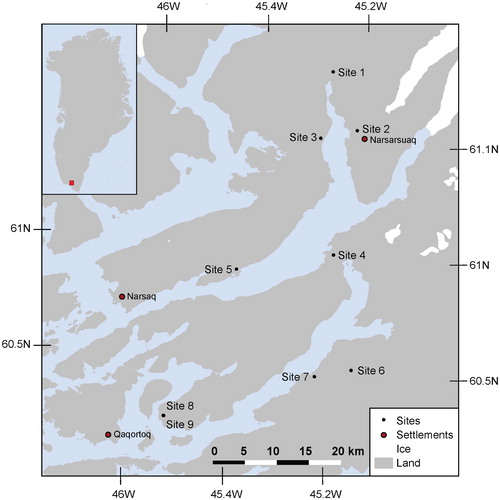
TABLE 1 Overview of plots with information on geographical area, study site, years vegetation analyses were conducted, whether the plot was inside (YES) or outside (NO) an exclosure, and location (in decimal degrees).
FIGURE 2. Sampling design and position of pinpoint frames (a) in a 15 × 15 m square or (b) along a 20 m transect. The numbered squares correspond to pinpoint frame 1–4.
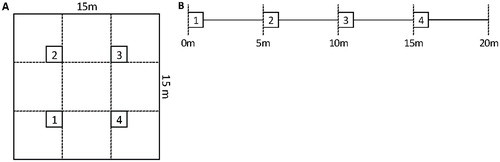
TABLE 2 Deviance information criterion (DIC) for the four models of the expected annual change of the four vegetation types (Models 2a, 2b, 2c, 2d).
TABLE 3 Percentiles of the marginal posterior distributions of the parameters for the best statistical model (Model 2a) for the three functional types (and the residual group “other”).
FIGURE 3. Variations in observed plant cover of three plant functional types (woody plants, graminoids, forbs) at the nine study sites (1–9). Unbroken lines indicate plant cover in grazed areas (outside exclosure) and dashed lines indicate plant cover inside exclosures.
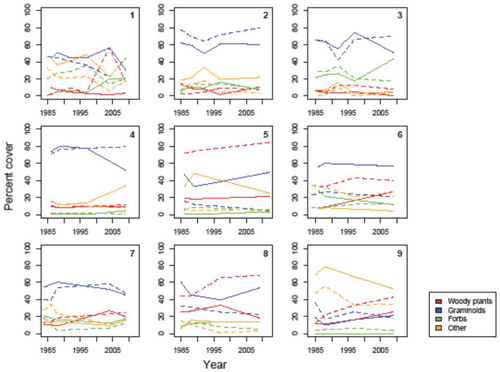
FIGURE 4. The expected annual change in logit-transformed vegetation cover as a function of the grazing intensity (sheep km-2). The median (black lines) and 95% credibility interval of the expected annual change in vegetation cover (gray-shaded areas) were calculated from the Bayesian joint posterior distributions of the parameters.
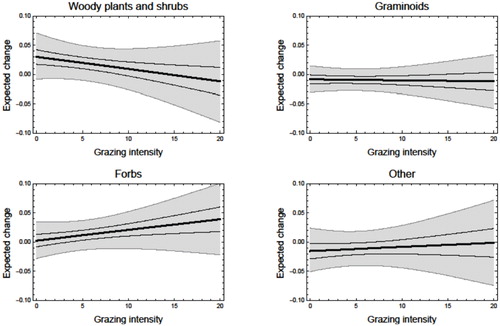
TABLE 4 Percentiles of the marginal posterior distributions of the parameters for the model including a grazing effect but no climate variables (Model 2b) for the three functional types (and the residual group “other”).
FIGURE A1. Modeled climate changes on the study sites during the period 1989–2012. Annual and monthly statistics were derived from daily values.
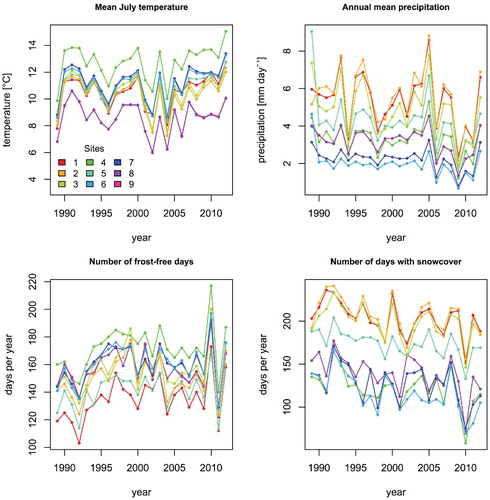
FIGURE A2. Changes in shrub cover in ungrazed plots (i.e. inside exclosures). A and C are from 1986 and 1992, respectively, whereas B and D are from 2009. Figure A and B show Site 5 (Ipiutaq); C and D show Site 1 (Qinngua Kangilleq). Photos: J. Feilberg/K. Raundrup.
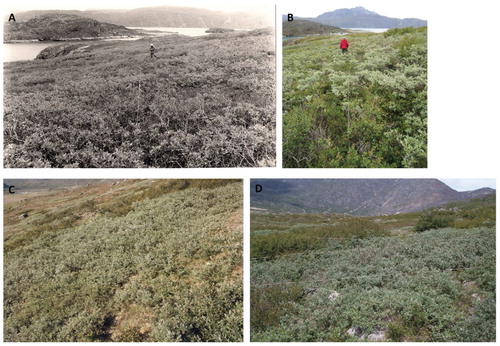
FIGURE A3. Changes in shrub cover in grazed plots. A and C are from 1986 and 1992, respectively, whereas B and D are from 2009. Figure A and B show Site 5 (Ipiutaq); C and D show Site 1 (Qinngua Kangilleq). Photos: J. Feilberg/K. Raundrup.
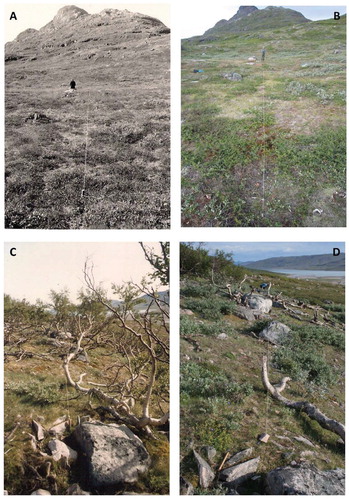
TABLE A1 List of plant species determined in the pinpoint analyses. The list includes information on functional group, species name, data on the number of pinpoint hits for each species in ungrazed plots (Exclosure, Yes) and grazed plots (Exclosure, No), and percentage of the species growing inside an exclosure.
Table
Table