Figures & data
FIGURE 1. (A) Location of the four study sites in the southern Coast Mountains of British Columbia. Lighter areas are mountain tops and darker areas are rivers and valley bottoms. Inset map shows the location of Lillooet (50.686°N, 121.936°W) in British Columbia. Detailed locations of all sites are found in . (B) Photograph of whitebark pine at Texas Creek. Each site shared similar open-canopy and herbaceous groundcover characteristics.
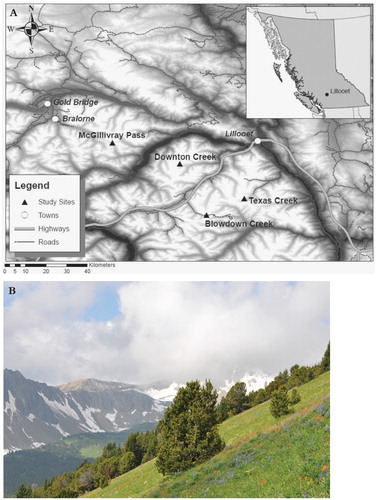
TABLE 1 Study site locations and characteristics. Mean annual precipitation (MAP), mean annual temperature (MAT), and precipitation-as-snow (PAS) come from the ClimateWNA 1961—1990 climate normals.
FIGURE 2. (A) Time series plot of the regional ring-width index (n = 61) showing that the expressed population signal (EPS) falls below 0.80 at 1920. (B) Time series of EPS-truncated regional ring widths and mean autumn (previous October through previous December) precipitation-as-snow (PAS).
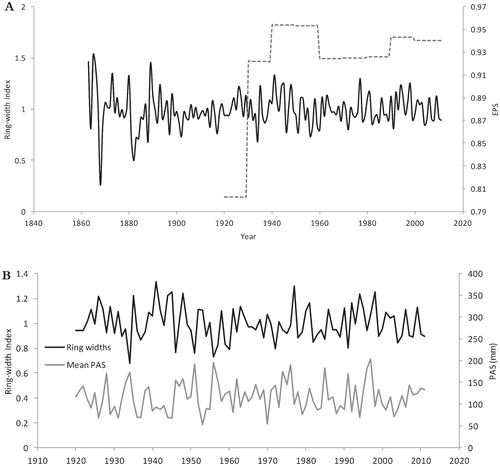
TABLE 2 Regional whitebark pine chronology statistics. EPS is the expressed population signal.
FIGURE 3. Scatterplot of the negative correlation between regional annual ring widths and autumn 250 (previous October through December) PAS.
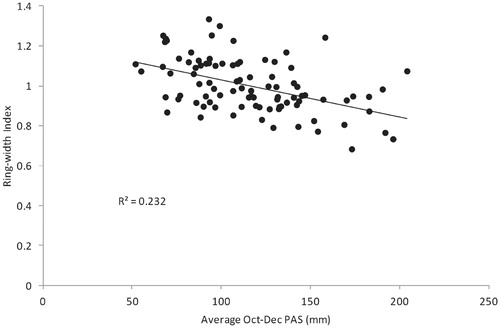
FIGURE 4. Single-month and strongest seasonal correlations (top) and partial correlations (bottom) of the whitebark pine chronology with total PAS, mean temperature, and total precipitation data (1920–2011). Note that the y-axes have different scales. (A) Correlations with PAS (top) and partial correlations with mean temperature that are independent from the influence of PAS (bottom). Months and seasons that are not plotted could not be evaluated due to a lack of data. The strongest correlation with PAS is during prior October through December, and the strongest partial correlation with temperature is during December through February. (B) Correlations with precipitation (top) and partial correlations with mean temperature that are independent from the influence of precipitation (bottom). The strongest correlation with PAS is during prior October through December and the strongest partial correlation with temperature is during December through February. Note the overall absence of temperature sensitivity during the growing season, with the strongest single or seasonal summer correlation being r = — 0.23 (p < 0.01).
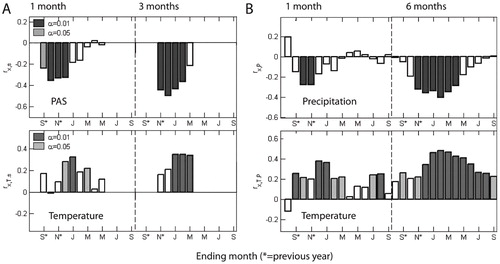
TABLE 3 Test of proportions assessing the association of whitebark pine ring widths and October—December PAS with strongest El Niño and La Niña events over the period 1950–1990. Test calculated using function prop. test in R. Proportions of years in each ring width or PAS category are in parentheses. For all tests, the null hypothesis that groups have the same true proportions could not be rejected, p-values ranged from 0.51 to 0.92.
FIGURE 5. Scatterplot showing the relationship between tree-ring widths and winter (previous November through current February) multivariate El Niño Southern Oscillation (ENSO) index. Low values (1–13) of the ENSO index represent strong to moderate La Niña events, with the lowest value corresponding to the strongest La Niña. High values (54–66) of the index represent moderate to strong El Niño events, with the highest value corresponding to the strongest El Niño. The 10 narrowest rings from the chronology are shown in white, and the 10 widest rings are shown in gray. All other rings are shown in black. The overall narrowest ring and widest ring of the chronology are denoted by the year in which growth occurred.
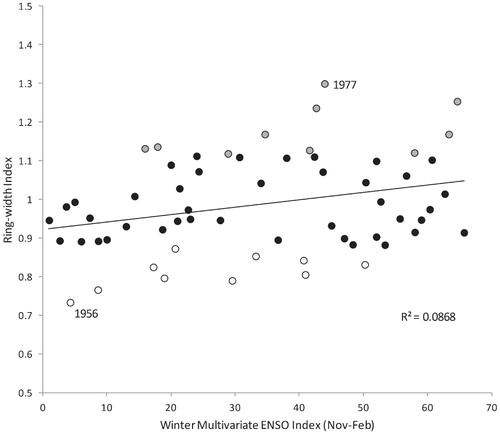
TABLE 4 Associations of whitebark pine ring widths and October-December PAS with instrumental winter Pacific Decadal Oscillation (PDO) variability.
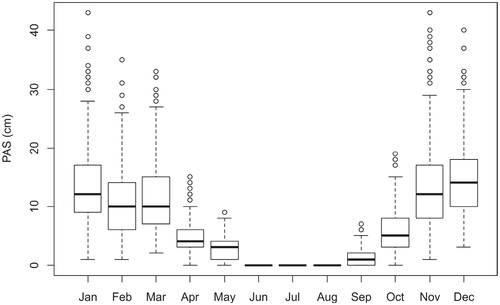
FIGURE 6. Box and whiskers plot of regionalized average monthly precipitation-as-snow (PAS). PAS data is from ClimateWNA for the period 1901–2011.