Figures & data
FIGURE 1. Location of the study area in eastern Qinghai-Tibet Plateau area, China.
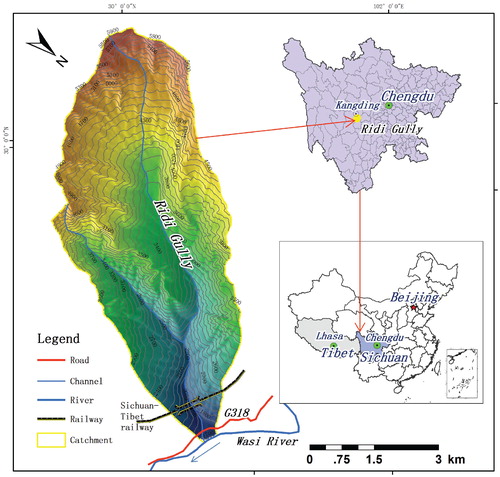
TABLE 1 Topographical parameters of channels in Ridi Gully.
Table 2 Statistical results at each slope classification of Ridi Gully.
FIGURE 2. Sources of loose solid materials for debris flow. (a) Slope failure, (b) bank collapse, and (c) moraine deposit.
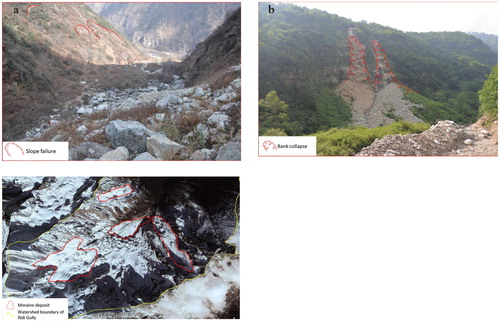
FIGURE 3. The average monthly precipitation at Kangding and Luding meteorological stations in the study area.
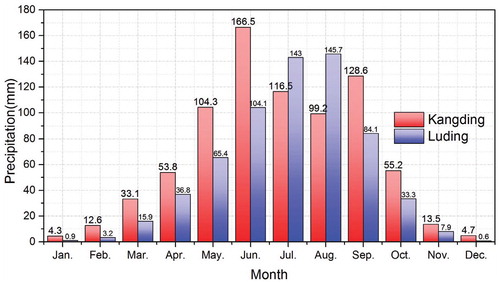
FIGURE 4. The longitudinal profile of main channel of Ridi Gully.
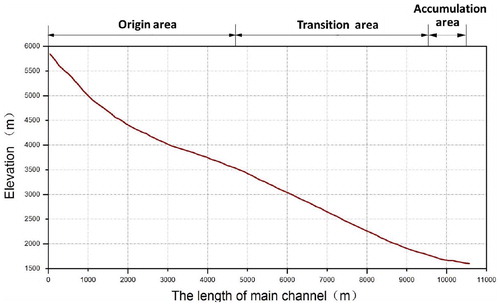
FIGURE 5. The grain-size distribution of the debris flow deposits in Ridi Gully.
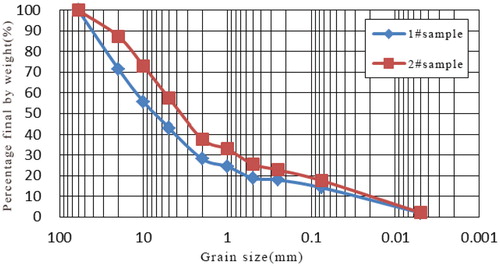
FIGURE 6. Malvern curve of sample #1 in Ridi Gully.
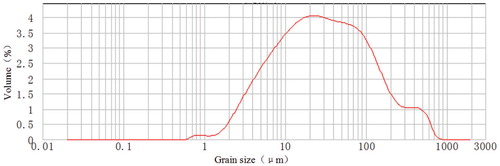
FIGURE 7. Malvern curve of sample #2 in Ridi Gully.
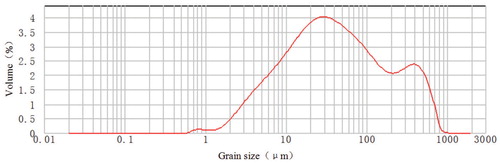
TABLE 3 Basic parameters and flood peak discharge of Ridi Gully.
TABLE 4 Debris flow peak discharge of Ridi Gully.
TABLE 5 Debris flow velocity of Ridi Gully
TABLE 6 The total volume of one debris flow and the total amount of solid material in Ridi Gully.
FIGURE 8. The snapshots of flow depth in Ridi Gully following a 100-year return period precipitation. (a) t = 150 s, (b) t = 600 s, (c) t = 900 s, and (d) t = 1500 s.
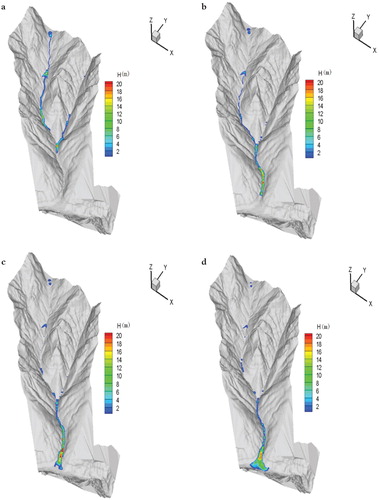
FIGURE 9. The snapshots of flow depth in Ridi Gully following a 200-year return period precipitation. (a) t = 150 s, (b) t = 600 s, (c) t = 900 s, and (d) t = 1500 s.
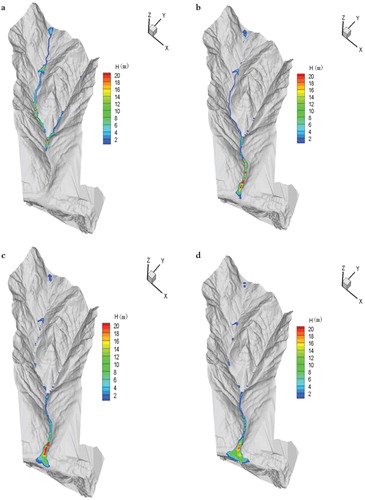
FIGURE 10. The section profile of Sichuan-Tibet Railway across Ridi Gully.
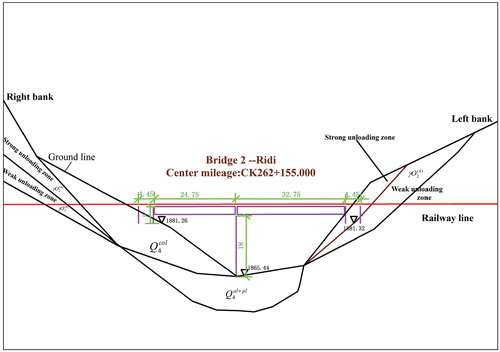
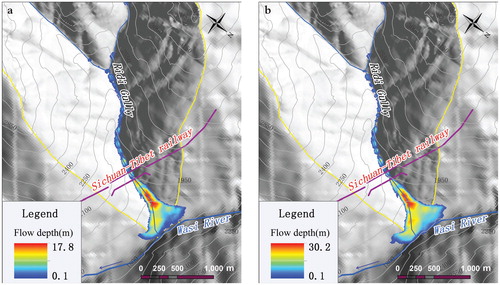
FIGURE 11. Simulated results of the Sichuan-Tibet Railway section in Ridi Gully. (a) Simulated result following a 100-year return period precipitation. (b) Simulated result following a 200-year return period precipitation.