
Figures & data
FIGURE 1. The flowchart for estimating the mean annual surface temperature (MAST) using the MODIS Aqua/Terra daytime and nighttime land surface temperature (LST) products. SFN is surface frost number.
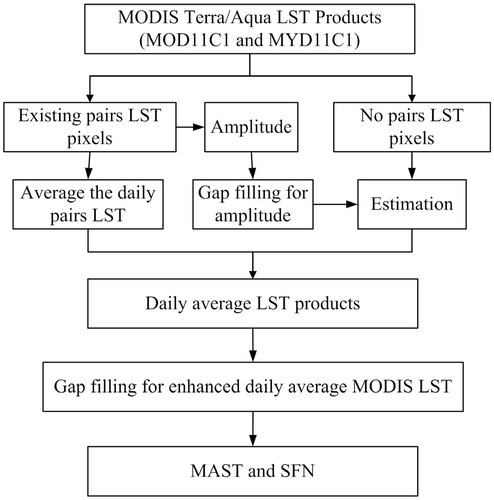
TABLE 1 Descriptions of the six sites in the permafrost region and two radiance-based LST sites.
FIGURE 2. The MAST and SFN in China in 2008 derived from MODIS LST products (left: MAST; right: SFN).
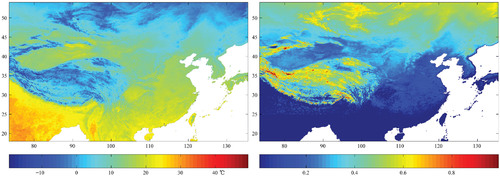
TABLE 2 Mean difference (MD), standard deviation of the MD (SD), and Pearson correlation coefficient (R) between MODIS LST and radiance-based LST (Arou and Yingke) or surface air temperature measurement (other sites).
FIGURE 3. The comparison of the estimated daily average LST with in situ daily average air temperature and radiance-based LST measurements in 2008.
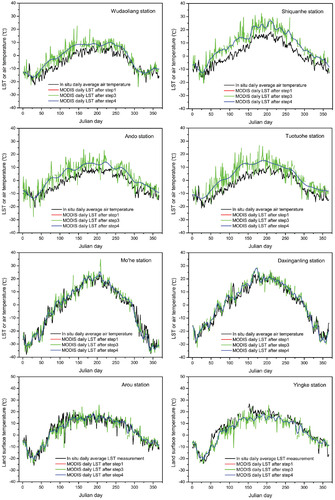
FIGURE 4. The spatial expansion and accuracy change along the method step for the daily average LST on the 300 Julian day in 2008 (26 October 2008).
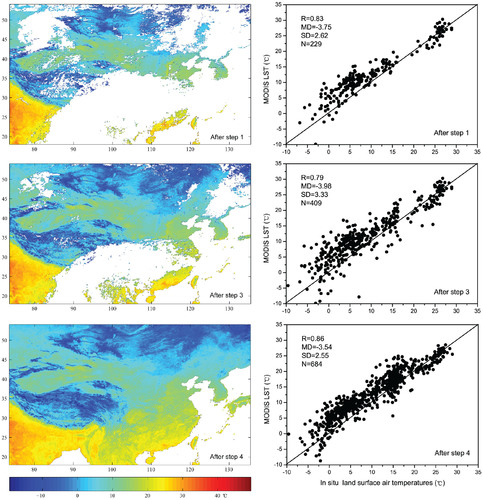
FIGURE 5. The relation of the estimated MODIS MAST and observed mean annual land surface air temperature (MAAT) in 2008.
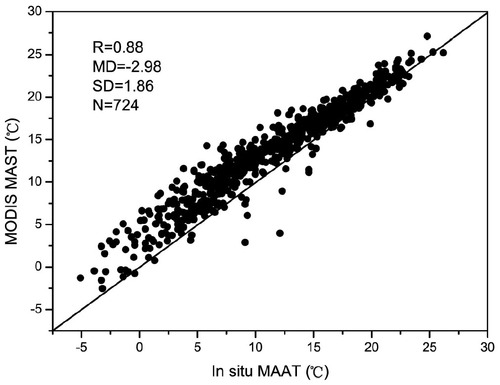
FIGURE 6. Comparison of the annual change between the in situ MAAT and the MODIS MAST. (The gray line is the in situ MAAT, and the black line is the MODIS MAST. Square: Wudaoliang; Triangle: Shiquanhe; Circle: Amdo; Pentagon: Tuotuo'he; Hexagon: Mo'he; Star: Daxinganling).
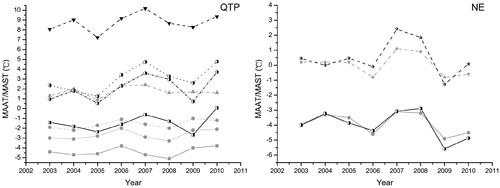
FIGURE 7. Relationship between the 8-year average MAST, SFN, and the southern/lower limits of permafrost in China (a) and in four enlarged areas: (b) along the Qinghai-Tibet engineering corridor, (c) in western QTP, (d) in southeastern QTP, and (e) in northeastern China.
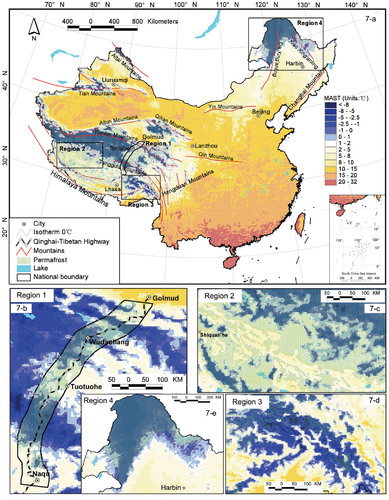
TABLE 3 The mean annual surface temperature (MAST) and surface frost number (SFN) along the southern and lower limits of permafrost in China.