Figures & data
(A) Sketch of the microfluidic PDMS pad. The pad has a size of 20 × 10 × 1 mm, and the microchannel is 1 cm long, 300 µm wide, and 50 µm deep. Two wells connect the microchannel with the top surface: an IN well (1.2-mm diameter) for reagent loading and an OUT well (0.7-mm diameter) for aspiration. (B) Complete structure of the FISH device (vertical section view). Glass slides are functionalized with ns-TiO2, then treated with oxygen plasma to increase wettability (R means chemisorbed oxygen radicals); finally, the PDMS microfluidic pad is assembled on the slide, by spontaneous adhesion. An exemplary picture of a FISH device is presented; a 10-µL tip is used for cell loading.
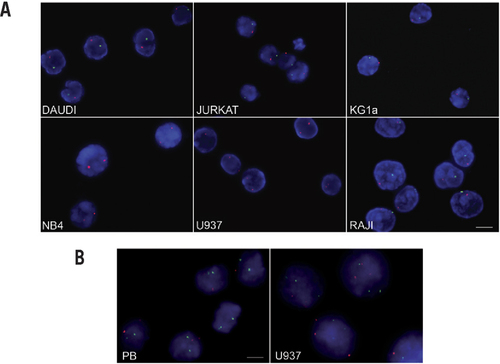
(A) Panel of tumor cells with CEP probes for sex chromosomes. Images from representative cells are acquired at 40× objective magnification. Red signal represents chromosome X; green signal represents chromosome Y; scale bar, 10 µm. (B) PB from normal donor (control cells) and U937 cells analyzed with LSI AML1/ETO probe. Images from representative cells are acquired at 100× objective magnification. Red signal represents chromosome 8, while green signal represents chromosome 21; U937 cells showed trisomy for both chromosomes; scale bar, 4 µm.
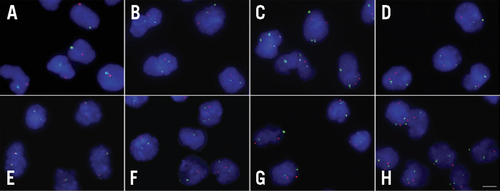
Miniaturized FISH analysis on hematopoietic cells from BM of normal donor with a panel of onco-hematology probes (Abbott Molecular, unless otherwise indicated): (A) Vysis CEP X SpectrumOrange/YSpectrumGreen Direct labeled fluorescent DNA probe kit; (B) Vysis LSIp53/ATM; (C) Vysis LSI D13S319/LSI 13q34/CEP 12 Multicolor probe; (D) Vysis LSI BCR/ABL Dual Color Dual Fusion Translocation probe; (E) Vysis LSI IGH Dual Color Break Apart Rearrangement probe; (F) Vysis LSI IGH/CCDN1 Dual Color Dual Fusion Translocation probe; (G) Poseidon Repeat Free 6q21 © SEM 6 Control probe (Kreatech); and (H) Vysis LSI AML1/ETO Dual Color, Dual Fusion Translocation probe. Representative images were acquired at 100× oil objective magnification. Scale bar, 5 µm.
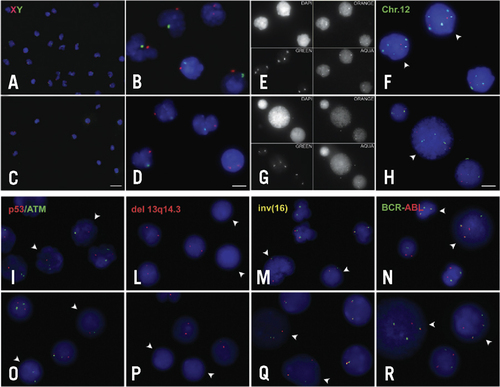
(Upper panel) Miniaturized FISH (A–D) and standard FISH (E–H) for sex chromosome chimerism detection (A, B, E, and F) and in a CLL case (C, D, G, and H) with chromosome 12 trisomy, respectively. (A and E) Merged images at 20× objective magnification; scale bar, 20 µm. (B and F) Merged images at 100× oil objective magnification; scale bar, 5 µm. (C and G) Raw images at 100× oil objective magnification representing single channels of the different fluorescent probes (orange, chr.13q14.3; green, chr. 12p11.1-q11; aqua, chr.13q34). (D and H) Merge of different channels in panels C and G, respectively. Scale bar, 5 µm. (Lower panel) Miniaturized FISH (I–N) and standard FISH (O–R): genetic lesions detected are p53/ATM deletion in a CLL case (I and O), 13q14.3 deletion in a CLL case (L and P), chromosome 16 inversion in an AML case (M and Q), and BCR-ABL translocation in a CML case (N and R). Images are acquired at 100× oil objective magnification. White arrows on each image indicate nuclei with the relative specific genetic lesion detected.