Figures & data
Table 1. Summary of Peak Area Comparisons
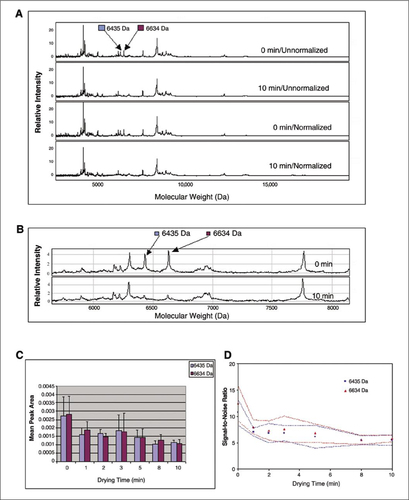
(A) Representative unnormalized and normalized spectra at time point 0 min and time point 10 min. (B) Expanded view of normalized spectra showing peaks of interest at time point 0 min and time point 10 min. (C) Mean peak area (± sd) representation for two peaks of interest at each drying time. (D) Mean signal-to-noise ratio (± sd) representation for two peaks of interest at each drying time.