Figures & data
The upper left-hand corner of each panel starts at row 67 and column 18 of an intact microarray image from an Agilent Human 1A microarray. The arrows show that the stripped arrays were switched and hybridized with the other sample. (A and B) The same section from two virgin arrays hybridized individually with cRNA of each sample indicated. (A-Stripped and B-Stripped) The same sections from the two stripped arrays scanned before the second hybridization. (C and D) The same sections from the two stripped arrays hybridized individually with cRNA of the indicated flipped sample.
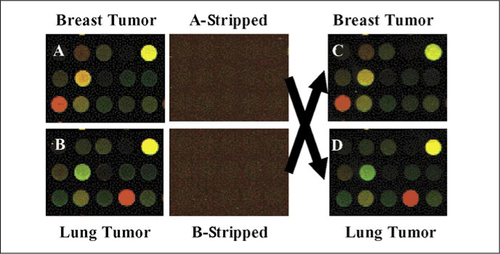
Table 1. Intraclass Correlation (ICC) of Four Virgin Arrays Versus Their Stripped Counterparts Hybridized with Two Different Tumor Samples
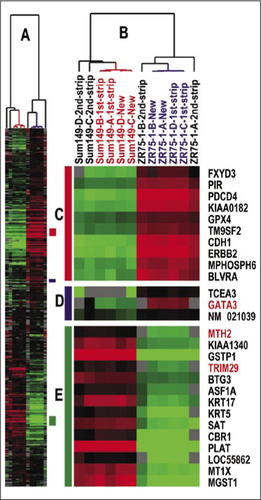
(A) Scaled-down version of the complete cluster diagram. (B) Close-up of the sample-associated dendrogram. (C) Luminal epithelial gene cluster. (D) A second luminal epithelial enriched cluster. (E) Basal epithelial-enriched gene cluster.