Figures & data
(A) Mitochondrial membrane potential (MMP) as a function of time. MMP was measured as ratio of complexed 5,5,6′,6′-tetrachloro-1,1′,3,3′-tetraethylbenzimidazolcarbo-cyanine iodide (JC-1) in brain cell suspensions. Mitochondrial depolarization with valinomycin results in JC-1 ratio of 0.2. (B) Time-dependent reactive oxygen species (ROS) production was detected as fluorescence of cells stained with dihydrochlorofluorescein (DHCF)-diacetate. (C) Increase in autofluorescence of cells with time. Circles, adult brain cells; triangles, embryonic brain cells.
(A) MMP of isolated mitochondria incubated in respiration buffer prior to addition of Pyr/mal (1.5/3 mM), rotenone (0.5 µM), succinate (1 mM), and antimycinA (10 µg/mL) as indicated. (B) Parallel autofluorescence measurement (measured by flow cytometry in FL1 channel) of respiring mitochondria treated as in panel A, but without 5,5,6′,6′-tetrachloro-1,1′,3,3′-tetraethylbenzimidazolcarbo-cyanine iodide (JC-1). Mitochondria were isolated from adult brains (circles) and embryonic brains (triangles).
Fraction of unattached cells as a function of plating time. (A) Longer periods after plating, between 0–8 h. (B) Shorter periods up to 1 h after plating. Grey circle indicates the fraction of cells that survived a prolonged time in isolation mixture without being plated onto poly-L-ornithine-coated dishes. Samples were taken during the incubation, and cells were counted on a Hy-Lite Hemacytometer (0.1 mm deep; Hausser Scientific, Horsham, PA, USA).
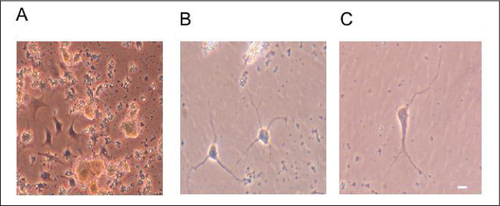
Images are dispersed striatal cells after 5 days in culture when cells were isolated using the described methodology: (A) without the use of papain before plating; (B) with 5 min of papain treatment before plating; or (C) after two 10-min papain treatments before plating. Scale bar indicates 20 µm. Cell images were taken by a digital camera mounted on a Nikon TMS-12807 microscope with a 20× lens.
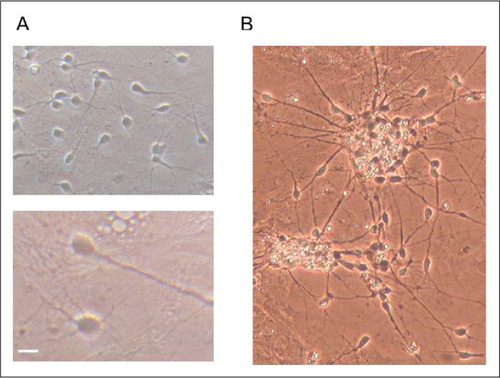
Brain cells from the striatum of 1-year-old bl6 mice were cultured as described. (A, top) Neuronal growth of dispersed striatal cultures containing both neurons and glia after 20 days in culture. (A, bottom) Magnification (2×) of the same cultures. (B) Some neuronal death can occur after medium replacement and is observed as bright bodies. Scale bar indicates 20 µm. Cell images were taken by a digital camera mounted on a Nikon TMS-12807 microscope with a 20× lens.