Figures & data
(A) Triplex of forward primer, blocker and WT template with 3′ end base ‘A’ on forward primer forms a base-pairing with 5′ end base ‘T’ on blocker resulting in a tight three-way binding triplex (inverse T shape) and preventing base extension due to 3′ end base modification on the blocker. (B) With a mutant template participating in the complex, 3′ end blocker opens up due to noncomplementary base pairing between T–T. Instead, 3′ end of primer forms an A–T base pairing with the mutant template, allowing the forward primer to be base-extended and displacing the blocker. (C) An alternative configuration to the triplex with the WT template in duplex only with a primer, but this configuration is suppressed significantly compared with the triplex due to a base mismatch at the 3′ end of the primer.
WT: Wild-type.
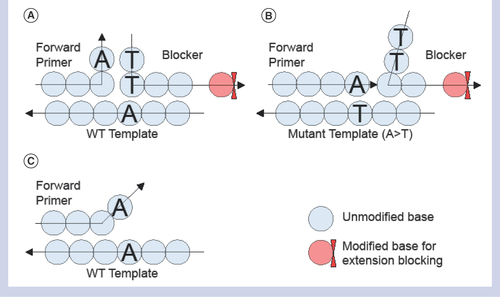
Table 1. Sequence of the primers, blockers and their melting temperatures.
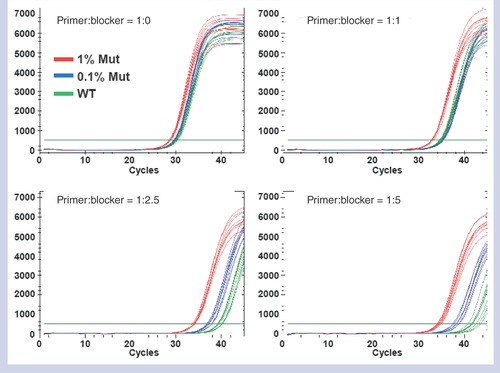
The separation of cycle of threshold (Ct) between 0.1% (blue curves) mutant and WT (green curves) reactions grows as blocker ratio increases. All the curves were acquired in a single run with eight replicates per case per sample. With the blocker titration result at a small scale as shown, another set of tests was run with a larger number of replicates with the two best performing blocker ratios to pick the best ratio. For the example of G12S assay shown above, only 1:2.5 and 1:5 ratios were run again with twice the number of replicates, which led to selecting the blocker ratio of 1:5 (data not shown). The primer to blocker ratios of the other three assays were optimized following the same procedure described above and the best ratios were determined to be 1:1, 1:2.5, and 1:2.5 for KRAS G12C, KRAS G12V and BRAF V600E assays, respectively.
WT: Wild-type.
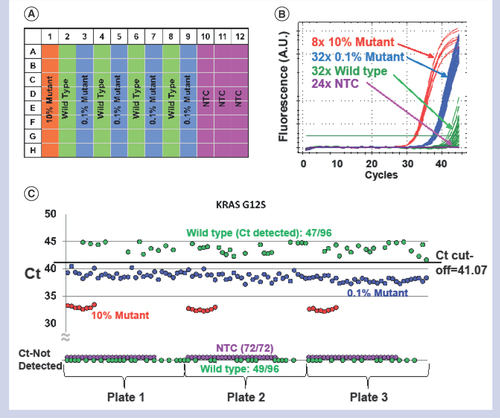
(A) Plate setup for sensitivity test that holds 8x 10% mutant, 32x 0.1% mutant, 32x wild-type and 24x NTC reactions. Three plates of this configuration were run per assay. (B) qPCR data from one of the three sensitivity plates for G12S showing a clear separation between 0.1% and wild-type reactions. The green horizontal straight line in the graph indicates the threshold universally set at 500. (C) Ct’s from all three sensitivity plates for G12S consolidated in a single graph to visualize the Ct cut-off to separate between 0.1% mutant and WT reactions achieving 100% sensitivity and 100% specificity. Note that any data point at the bottom of the graph indicates Ct was not detected until 45 cycles and that no NTC reactions registered any Ct’s.
Ct: Cycle of threshold; NTC: No template control.