Figures & data
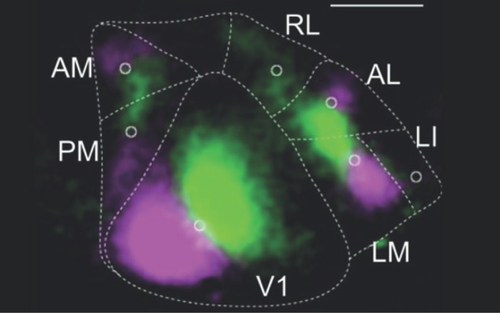
By barcoding 591 neurons in this region, the team used MAPseq to discover patterns of their projections to nearby higher visual cortical areas. Each of the latter is identified in this calibration image, which registers the brain’s reaction to two different kinds of visual stimuli (registering in pink and green fluorescence).
Credit: Zador Lab, CSHL.
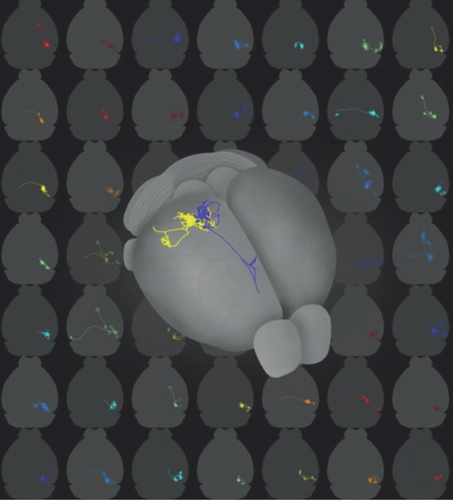
Each panel in the background shows the traced axon of a single neuron from the upper layers of primary visual cortex. The gray outlines are the brain borders. The foreground brain contains two traced cells overlaid in different colors.
Credit: Sainsbury Wellcome Centre.