Figures & data
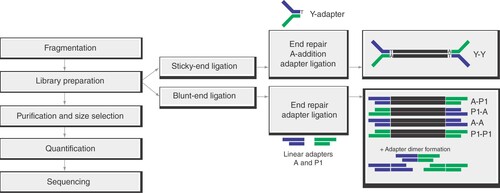
Y-adapters are ligated in a sticky-end fashion to the fragment, thereby yielding library molecules, of which both strands fulfill the prerequisites for sequencing. By contrast, two different linear adapters that are ligated in a blunt-end mechanism beside the functional library molecule (A-P1) also create nonsequenceable molecules as byproducts (A-A, P1-P1), resulting in lower conversion of sample DNA to functional library. Additionally, blunt-end ligation increases the chances for the formation of unwanted adapter dimers and input fragment concatemers.
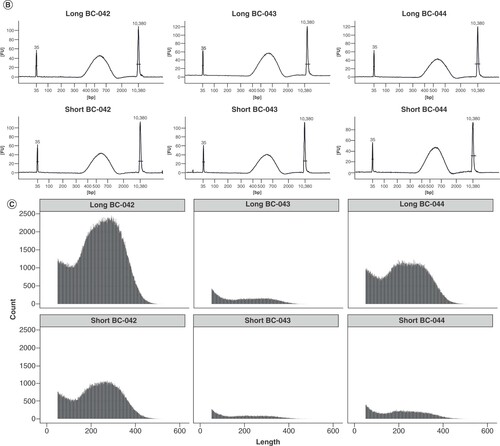
(A) Initial design of the stem regions with three different barcodes (BC-042, 043, 044) and two variants each of the stem length. The bar plot shows the library yield (upper x-axis), with 500 ng Escherichia coli DNA input for each of the designs; mean and standard deviation were calculated from three dilutions used in qPCR quantification. ×: Melting temperature (lower x-axis) of the respective stem. (B) Size distribution of the generated libraries as determined by Bioanalyzer high-sensitivity DNA analysis. (C) Read length histogram of sequencing results of equimolar pools of the long and short adapters in one run each, respectively. For comparison, please see B showing the expected size distributions.
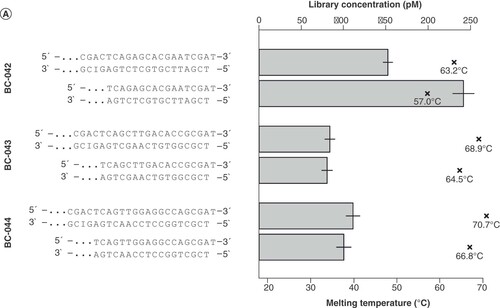
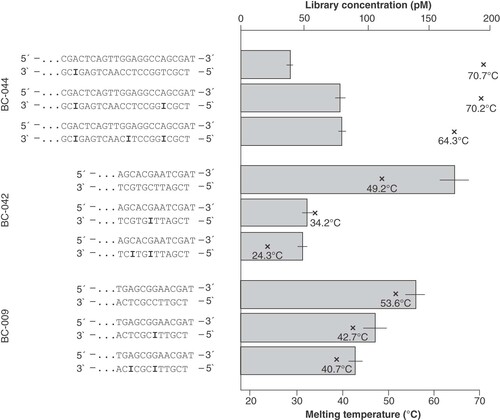
Design of the stem regions with three different barcodes and varying numbers of inosine nucleotides (bold). Input: 250 ng of cell culture DNA. The barplot shows the library yield (upper x-axis) for each of the designs, mean and standard deviation were calculated from three dilutions used in qPCR quantification.
×: Melting temperature (lower x-axis) of the respective stem.
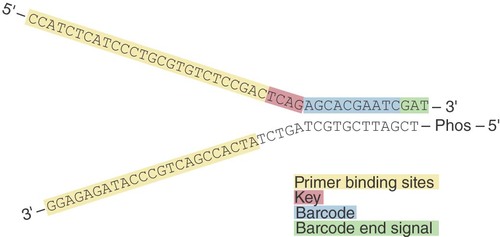
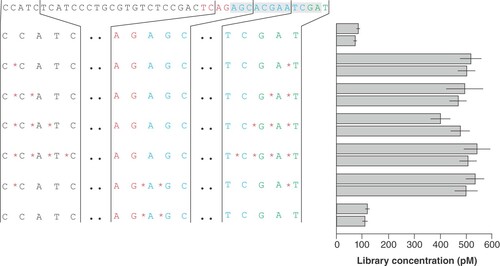
Design of the top oligonucleotides with barcode BC-042 and varying numbers of phosphorothioate bonds and different positions. Libraries were prepared from 500 ng fragmented Escherichia coli DNA in two independent experiments. The bar plot shows the library yield for each of the designs; mean and standard deviation were calculated from three dilutions used in qPCR quantification. Colored adapter sequence: Black: primer binding sites; red: key; blue: barcode; green: barcode end signal. The adapter part forming the double-stranded stem is shown with grey background.
*Phosphorothioate bonds.
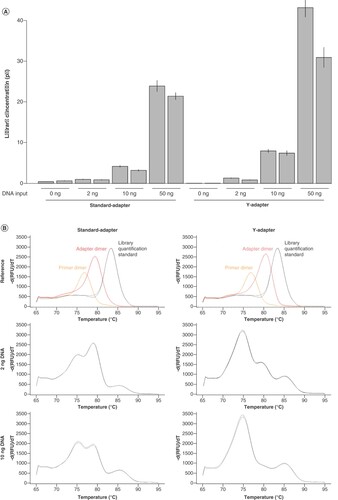
(A) Library concentration after library preparation without and with 2, 10 and 50 ng fragmented Escherichia coli DNA input. For optimal comparability, experiments were performed in duplicates with standard adapter BC-042 and Y-adapter BC-042, respectively. Mean and standard deviation were calculated from three dilutions used in qPCR quantification. (B) Melting curves generated after qPCR quantification for 2- and 10-ng DNA input, visualizing the presence of adapter dimers. Reference was assembled of single peaks for nontemplate control (primer dimer; yellow), library without input (adapter dimer; red) and library quantification standard (153 bp; black).
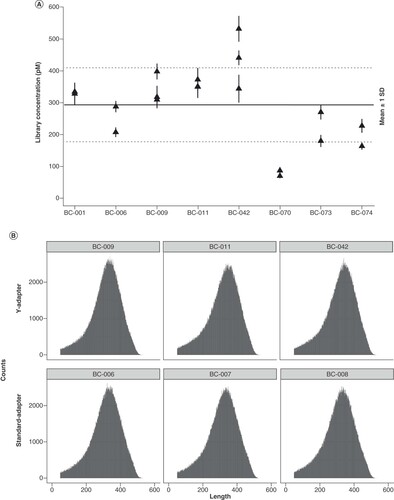
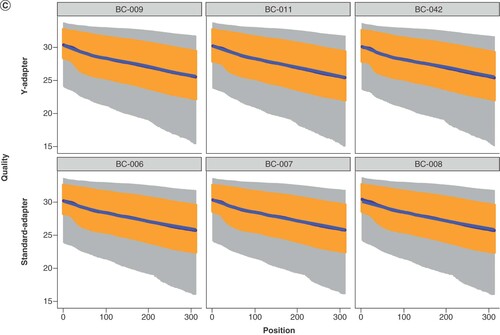
(A) Eight optimized Y-adapters for Ion Torrent sequencing were compared on their ligation efficiency when ligated to the same fragmented Escherichia coli DNA, 500 ng, in two or three (BC-009, BC-042) independent experiments. The plot shows the library yield for each of the adapters; mean and standard deviation were calculated from three dilutions used in qPCR quantification. The horizontal line indicates the mean concentration of all libraries shown in the plot, the dashed lines indicate the mean ± 1 standard deviation. (B) Key metrics of sequence data generated on an Ion S5 XL using standard Ion Torrent adapters or custom Y-adapters. Read length histograms for E. coli libraries prepared using Y-adapters (top) or standard adapters (bottom). (C) Quality plot of the same libraries after trimming to a uniform sequence length and number of bases.
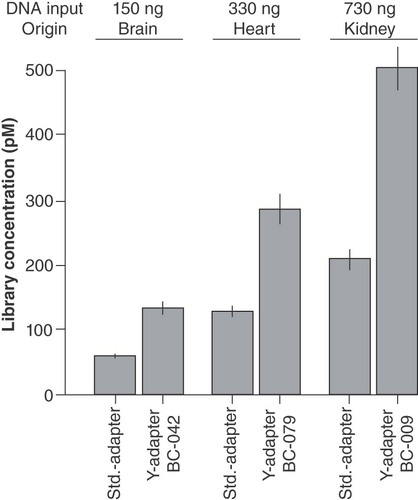
Shown are the mean yield, including standard deviation calculated from three dilutions used in qPCR quantification.