Figures & data
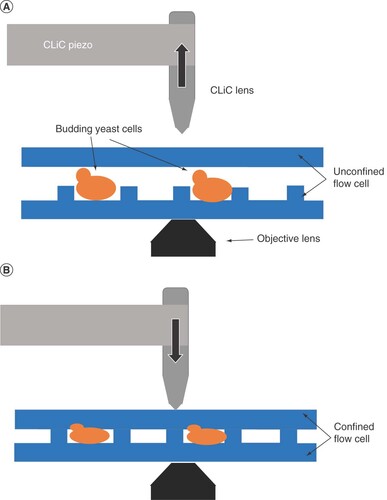
(A) Representative schema of the CLiC instrument with yeast cells loaded into the unconfined flow cell that contains embedded pits. (B) Schematic representation of the CLiC instrument with the lens rod moving downward to confine the yeast cells into the flow cell pits.
CLiC: Convex lens-induced confinement.
(A) Representative images of BY4743 unstained (-) or stained with FM4-64 vacuolar stain (+) and captured under a traditional microscope slide or when confined in the CLiC flow cell. Imaging performed under BF channel and fluorescent channel (Cy3, FM4-64). (B) Box and Whisker plot of corrected total cell fluorescence distribution for n ≥ 300 cells per condition.
BF: Brightfield; CLiC: Convex lens-induced confinement; CTCF: Corrected total cell fluorescence; S:N: Signal-to-noise ratio.
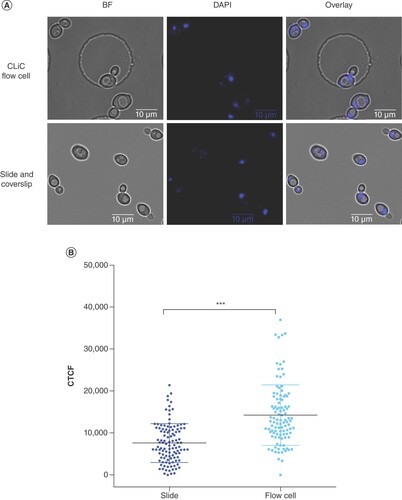
(A) DAPI-stained BY4743 cells captured under BF and fluorescent (DAPI) channels. Imaging performed under flow cell confinement (top) and on a microscope slide (bottom). (B) Column scatter plot of CTCF of n ≈ 100 cells per condition. Image displays individual data (blue markers), their average (black horizontal lines) and standard deviation (blue error bars) for each condition.
***p < 0.05 under an unpaired two-tailed t-test.
BF: Brightfield; CLiC: Convex lens-induced confinement; CTCF: Corrected total cell fluorescence; DAPI: 4′,6-diamidino-2-phenylindole.
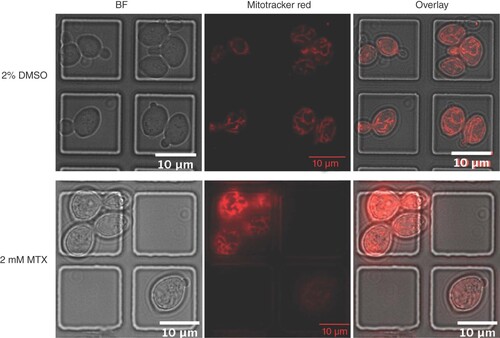
mitotracker stained BY4743 cells treated for 20 h with 2% DMSO vehicle control (top) or 2 mM methotrexate (bottom) and captured in flow cells under BF and Cy3 Fluorescent (Mitotracker Red™) channels.
BF: Brightfield; DMSO: Dimethyl sulfoxide; MTX: Methotrexate.
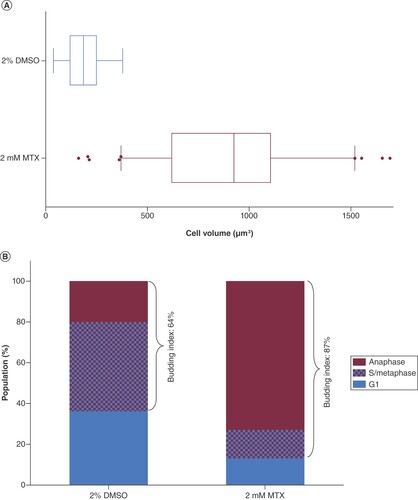
(A) Box and Whisker plot representation of the cell volume distribution of n = 100 BY4743 cells treated for 20 h with 2 mM MTX versus the control treated with 2% DMSO. (B) Population percentage of cells in anaphase, S/metaphase and G1 phase of the cell cycle and the deduced budding indices of MTX- versus DMSO-treated cells.
DMSO: Dimethyl sulfoxide; MTX: Methotrexate.
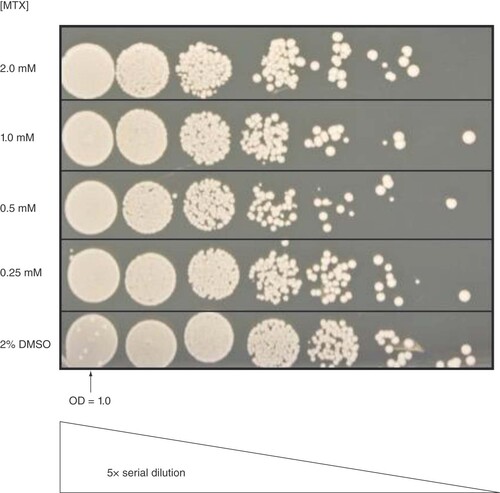
Cells treated for 20 h with 2.0 , 1.0 , 0.5 or 0.25 mM MTX, or 2% DMSO, spotted onto YPD agar and incubated for 48 h are displayed on this image. From left to right, spots correspond to 5× serially diluted cells starting with a cell suspension with an OD600 nm of 1.0.
DMSO: Dimethyl sulfoxide; MTX: Methotrexate.
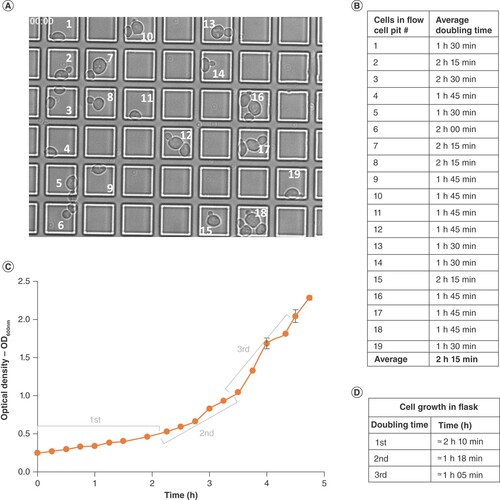
(A) Timepoint 00:00 image of cells confined in convex lens-induced confinement flow cell and grown at 30°C in YPD for 8 h (refer to Supplementary Video 1 for complete growth cycle) and numeric labeling of pits containing cells. (B) Average doubling time of cells in Figure 7A numerically labelled pits. (C) Growth curve of cells grown in flask at 30°C with shaking in YPD, n = 2. (D) First, second and third doubling time of cells grown in flasks and deduced from Figure 7C.