Figures & data
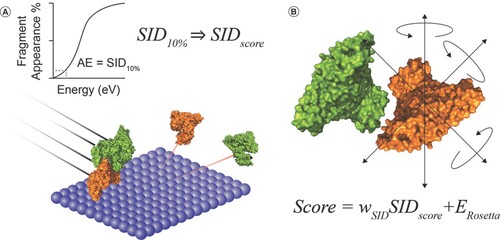
(A) A depiction of surface-induced dissociation (SID) and a graphical representation of the generation of SID appearance energy. (B) A molecule model generated in Rosetta and the Scoring function equation.
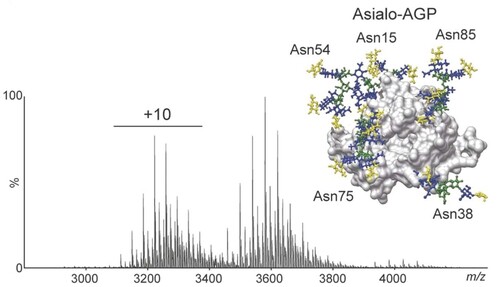
Blue: GlcNAc; Green: Man; Yellow: Gal.