Figures & data
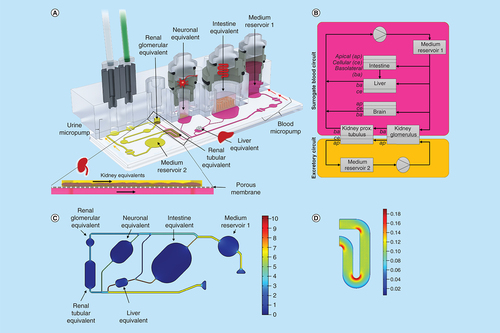
3D view of the four-organ-chip (A), physiologically inspired model of the four-organ-chip (B). Pink: surrogate blood circuit, yellow: excretory circuit. Calculated velocity distribution (mm/s) at a flow rate of 16.9 μl/min in the surrogate blood circuit (C). Distribution of the wall shear stress (Pa) in the tubular compartment of the excretory circuit at a mean shear stress of 0.1 Pa (D).
Measured by LDH activity (A) and glucose balance (B). Means with standard deviation are plotted. n = 10. The physiological glucose concentration range in the human blood [Citation38] (red area) and urine [Citation39] (light yellow area) of healthy people is drawn for comparison.
![Figure 2. Systemic tissue viability in the four-organ-chip over 14 days of coculture.Measured by LDH activity (A) and glucose balance (B). Means with standard deviation are plotted. n = 10. The physiological glucose concentration range in the human blood [Citation38] (red area) and urine [Citation39] (light yellow area) of healthy people is drawn for comparison.](/cms/asset/8837cce2-30a7-498f-91ed-a1b2526471b0/ifso_a_12364213_f0002.jpg)
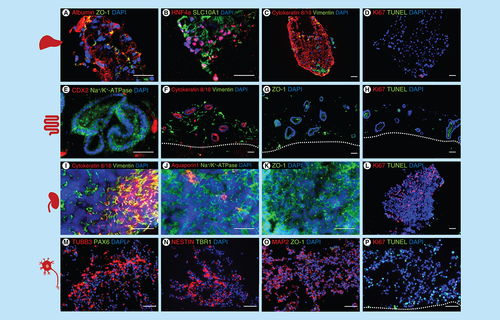
Immunostaining A–P: A–D liver spheroids: (A) albumin and ZO-1, (B) Hepatocyte nuclear factor 4 alpha and SLC10A1, (C) cytokeratin 8/18 and vimentin, (D) Ki67 and TUNEL. (E–H) intestinal model: (E) CDX2 and Na+/K+-ATPase, (F) cytokeratin 8/18 and vimentin, (G) ZO-1, H: Ki67 and TUNEL. (I–L) renal model: (I) cytokeratin 8/18 and vimentin, (J) aquaporin 1 and Na+/K+-ATPase, (K) ZO-1, (L) Ki67 and TUNEL. (M–P) neuronal model; (M) TUBB3 and PAX6, (N) nestin and TBR1, (O) MAP2 and ZO-1, (P) Ki67 and TUNEL. Scale 50 μm.
Five different human iPSC lines were analyzed for comparison.
iPSC: Induced pluripotent stem cell.
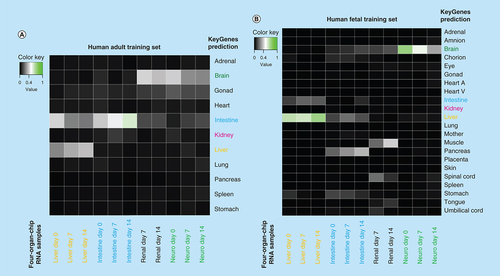
KeyGenes prediction with the human adult training set (A) and the human fetal training set (B). The identity scores range from 0 (black – no match) to 1 (green – high match). The rows represent the 11 (A) or 22 (B) organs from the human training set and the columns depict the four-organ-chip cocultured RNA samples. Light grey and green boxes show the predicted tissues for the given samples by KeyGenes.