Figures & data
Table 1. Summary of patient’s characteristics and extracorporeal photopheresis sessions.
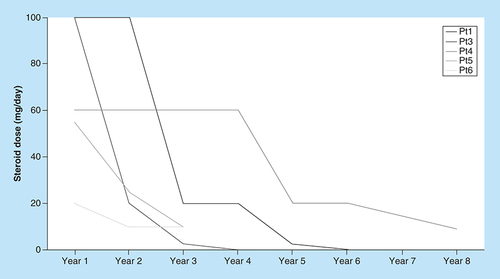
Patient two not shown due to nonprednisolone containing scheme.
Pt: Patient.
All responding patients had a significant increase in %Tregs comparing the first to the last year of treatment (p < 0.001). Patient three, who did not respond to extracorporeal photopheresis, had not (p = 0.19).
Pt: Patient.
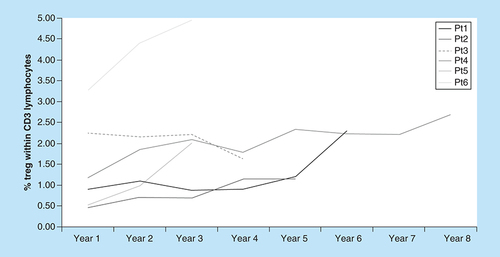
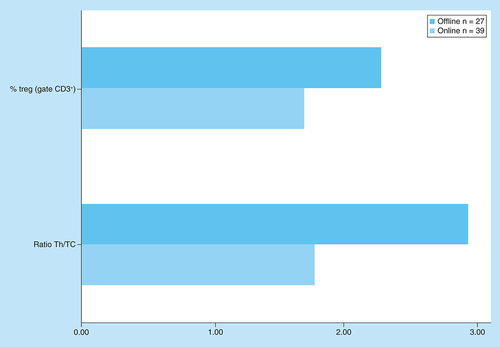
Th/Tc: T helper/cytotoxic T cell; Treg: Regulatory T cell.