Figures & data
Table 1. Patient characteristics.
Table 2. MET mutation therapies.
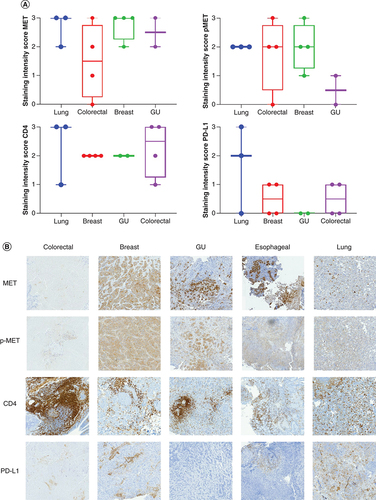
(A) Box plot representing the staining intensity IHC scores of c-MET, p-MET, PD-L1 and CD4 per disease type (lung, colorectal, breast and GU cancer). IHC staining of lung, colorectal, breast and GU tumor tissue with MET, p-MET, CD4 and PD-L1 antibodies was scored on a scale from 0 (no staining/no protein expression) to 3+ (strong staining/high protein expression). Staining intensity scores of MET, p-MET, CD4 and PD-L1 are mean ± SE. Statistical analyses were conducted using GraphPad Prism 8 by one-way ANOVA, followed by Tukey's multiple comparison test. No significant differences were seen between groups. (B) IHC staining of MET, p-MET, CD4 and PD-L1 for each disease type (colorectal, breast, GU and lung cancer).
ANOVA: Analysis of variance; GU: Genitourinary; IHC: Immunohistochemical; SE: Standard error.
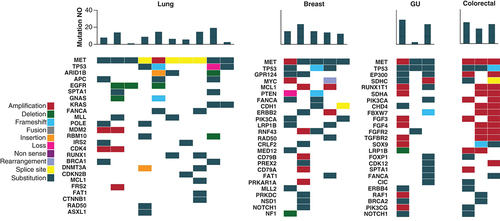
MET patients are categorized by cancer primary site. The heatmap demonstrates the genomic profile of each patient's tumor as well as the total number of mutations identified through NGS testing. The number of mutations per patient is shown in the bar chart at the top, with a heatmap of the genomic alterations identified underneath. The different types of genomic alterations identified in this cohort were classified as amplification, deletion, frameshift, fusion, insertion, loss, non-sense, rearrangement, splice site and substitution.
NGS: Next-generation sequencing; GU: Genitourinary; NO: Number.
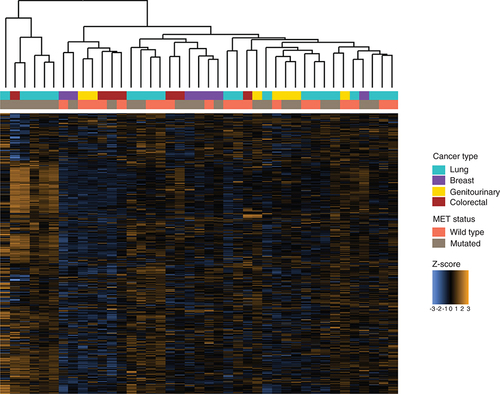
Z-scores for 770 genes assayed using the multiplex gene expression panel in each tumor sample, annotated with cancer type and MET status.
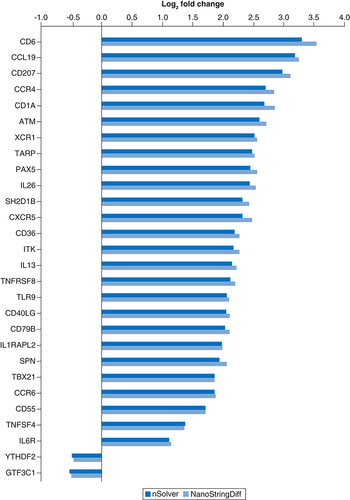
All genes passing the FDR cutoff p < 0.05 for both tools are plotted. See Supplementary Tables for full lists of genes identified by each individual tool.
FDR: False discovery rate.