Figures & data
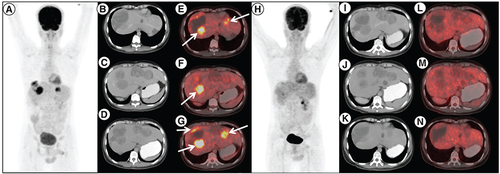
18F-Fluorodeoxyglucose (FDG) positron emission tomography/computed tomography (PET/CT) done post imatinib, sunitinib and regorafenib therapy in patient A. (A) maximum intensity projection, (B, C & D) axial contrast enhanced CT and (E, F & G) fused PET/CT images showing multiple solid cystic masses with increased FDG uptake in the enhancing solid component (arrows) suggestive of metabolically active liver metastases. Follow-up 18F-FDG PET/CT done 3 months after initiation of avapritinib therapy, which revealed resolution of metabolic activity in the corresponding lesions (H–N) with hypodense/cystic changes in the previously enhancing lesions, suggestive of complete metabolic response.
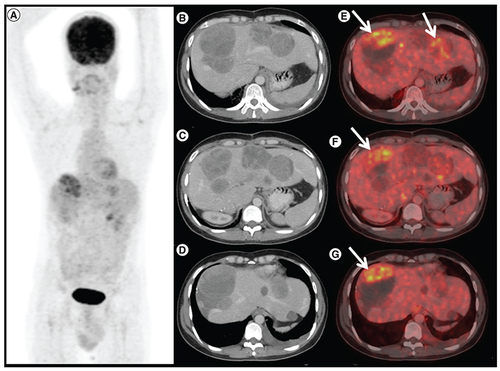
1 8F-FDG positron emission tomography/computed tomography (PET/CT) done 6 months after avapritinib therapy in patient A. (A) Maximum intensity projection, (B, C & D) axial contrast enhanced CT and (E, F & G) fused PET/CT images shows increase in size of the liver lesions with FDG avid enhancing areas in the periphery of the lesion (arrows), suggestive of progressive disease.
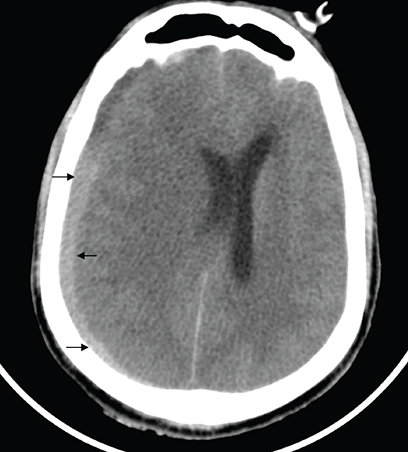
Computed tomography head of patient B showing biconcave hyperdensity in the right parieto-occipital location with associated midline shift suggestive of subdural hemorrhage.
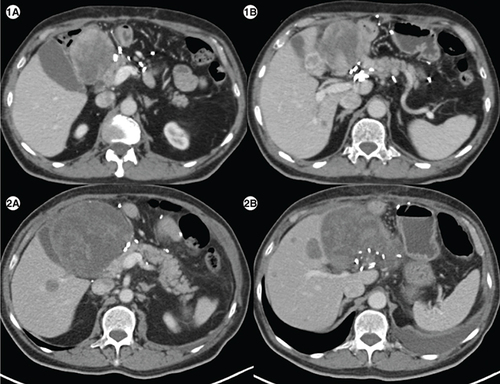
(1A) Axial computed tomography abdomen of patient E showing a heterogenous mass measuring 7.1 × 6.6 cm in the surgical bed in the gastro-hepatic region and a hypodense lesion in segment IVB of liver (1B) measuring1.5 × 1.8 cm. (2A) Axial CT abdomen of first follow-up scan showing a heterogenous mass measuring10.2 × 10.7 cm in the surgical bed in the gastro-hepatic region and a hypodense lesion in segment IVB of the liver measuring 2.9 × 2.8cm (2B), suggestive of disease progression.
(3A) In a patient with PDGFRA D842V mutation (patient E), maximum intensity projection image of 18F-Fluorodeoxyglucose (FDG) positron emission tomography/computed tomography (PET/CT) showing physiologic biodistribution in the brain, liver, kidneys and urinary bladder. (3B) Axial CT abdomen showing a heterogenous mass measuring 5.5 × 6.0 cm in the surgical bed in the gastro-hepatic region and a hypodense lesion in the segment IVB of the liver 2.1 × 2.0 cm with no significant FDG uptake in any of the lesions on fused PET-CT images, suggestive of partial response (3C).
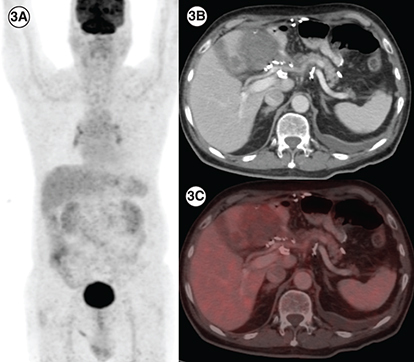
Table 1. Base line characteristics of patients.
Table 2. Avapritinib characteristics including response rates, progression free time, outcomes and toxicities.