Figures & data
Table 1. Clinical characteristics of the studied Type 2 diabetes mellitus patients and the two control groups.
Table 2. Laboratory analysis of the laboratory biomarkers among Type 2 diabetes mellitus patients and the two control groups.
Table 3. Logistic regression analysis for predicting the risk of different types of diabetic cardiomyopathy.
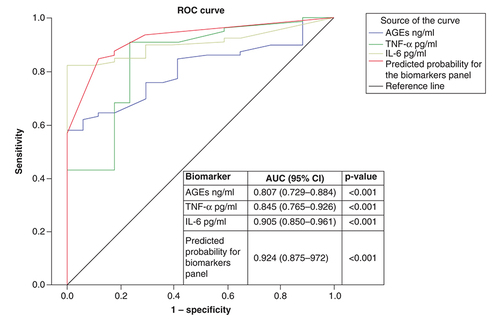
AGE: Advanced glycation end-product; AUC: Area under the curve; ROC: Receiver operating characteristic.
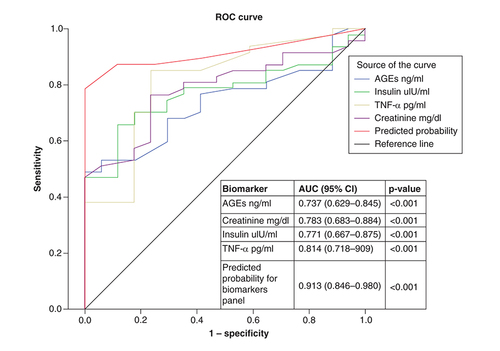
AGE: Advanced glycation end-product; AUC: Area under the curve; ROC: Receiver operating characteristic.
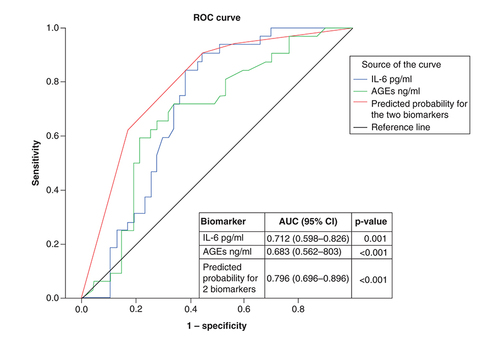
AGE: Advanced glycation end-product; AUC: Area under the curve; ROC: Receiver operating characteristic.