Figures & data
After obtaining the sample, the red cells underwent lysis. The 14-color panel was performed on whole blood cells. Subpopulations of peripheral immune mononuclear cells (T cells, CD4+ T cells, CD8+ T cells, CD4−CD8− T cells, CD4+CD8+ T cells, Tregs, B cells, NK cells, ILCs, basophils, MyDCs, pDCs, monocytes, classical [CD14+CD16−], intermediate [CD14+CD16low] and nonclassical [CD14+CD16hi] monocytes) were identified. The cellular gating depicted is representative of one healthy individual sample.
DC: Dendritic cell; FSC-A: Forward scatter area; FSC-H: Forward scatter height; HLA-DR: Human leukocyte antigen DR; ILC: Innate lymphoid cell; MyDC: Myeloid dendritic cell; NK: Natural killer; pDC: Plasmacytoid dendritic cell; SSC: Side scatter; Treg: Regulatory T cell; WBC: White blood cell.
![Figure 1. Flow cytometry panel from human peripheral blood.After obtaining the sample, the red cells underwent lysis. The 14-color panel was performed on whole blood cells. Subpopulations of peripheral immune mononuclear cells (T cells, CD4+ T cells, CD8+ T cells, CD4−CD8− T cells, CD4+CD8+ T cells, Tregs, B cells, NK cells, ILCs, basophils, MyDCs, pDCs, monocytes, classical [CD14+CD16−], intermediate [CD14+CD16low] and nonclassical [CD14+CD16hi] monocytes) were identified. The cellular gating depicted is representative of one healthy individual sample.DC: Dendritic cell; FSC-A: Forward scatter area; FSC-H: Forward scatter height; HLA-DR: Human leukocyte antigen DR; ILC: Innate lymphoid cell; MyDC: Myeloid dendritic cell; NK: Natural killer; pDC: Plasmacytoid dendritic cell; SSC: Side scatter; Treg: Regulatory T cell; WBC: White blood cell.](/cms/asset/dbe2a36c-4872-4bef-a96d-9f98a4cd2147/ifso_a_12364388_f0001.jpg)
Table 1. Optimized combination of 14 commercially available fluorochrome-conjugated antibodies to reliably quantify 18 subpopulations of immune cells.
Table 2. Demographic, clinical and serological features of patients with systemic lupus erythematosus.
Table 3. Differences in immune cellular compositions between patients with systemic lupus erythematosus and healthy controls.
Table 4. Differences in immune cellular compositions among patients with active systemic lupus erythematosus, patients with inactive systemic lupus erythematosus and healthy controls.
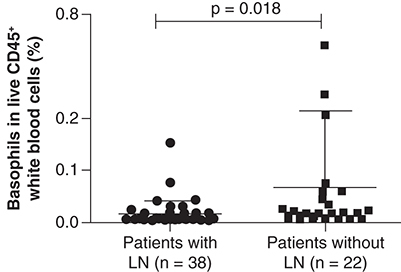
The proportion of basophils was decreased in patients with nephritis (n = 38) compared with patients without nephritis (n = 22). Data are shown as the mean ± standard deviation. p < 0.05 indicates statistical significance.