Figures & data
Table 1. Clinical characteristics of the pregnant participants and the microbiome species present in their amniotic fluid, analyzed using comprehensive miRNA array.
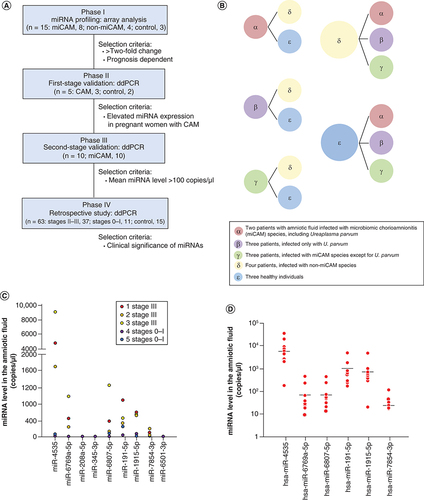
(A) Flowchart of the study design. Predictive biomarkers in the amniotic fluid for the diagnosis of chorioamnionitis were identified using comprehensive miRNA array analysis and ddPCR™. Phases I–IV were sequentially completed. (B) Fifteen pregnant women were divided into five groups. The levels of nine miRNAs were identified using comprehensive miRNA array analysis of the amniotic fluid samples from pregnant women with or without chorioamnionitis. (C) Expression of six miRNAs in the amniotic fluid of patients with microbiomic chorioamnionitis (miCAM). Red, orange and yellow circles indicate the miRNA levels in the amniotic fluid of three pregnant women with Blanc’s classification stage III; violet and blue circles indicate the miRNA levels in the amniotic fluid of two pregnant women with Blanc’s classification stages 0 or I. (D) Red circles indicate the miRNA levels in 10 pregnant women with Blanc’s classification stages II–III plus miCAM. The bars indicate the median.
miCAM: Microbiome chorioamnionitis.
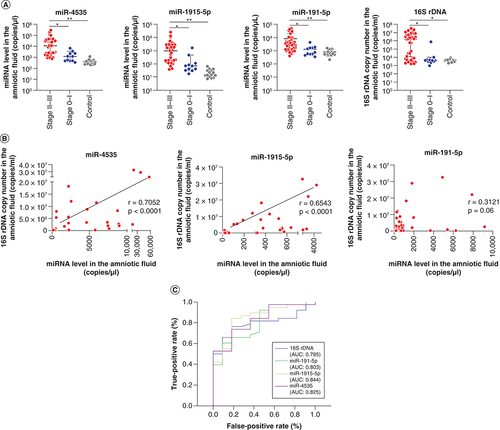
(A) Expression levels of each candidate miRNA and the copy numbers of 16S rDNA in pregnant women divided into three groups: Blanc’s classification stages II–III (group II–III: n = 37, red circles); Blanc’s classification stages 0–I (group 0–I: n = 11, blue circles); and healthy pregnant women between 15 and 17 gestational weeks (control: n = 15, gray circles). Data are expressed as the median ± 95% CI. Thick and thin bars indicate the median and 95% CI, respectively. Statistical differences among the groups were assessed using Dunn’s multiple comparison test. (B) Correlation between miRNA expression and 16S rDNA copy number in amniotic fluid samples from 37 pregnant women with Blanc’s classification stages II–III. r indicates the correlation index. (C) Diagnostic and predictive accuracies of miRNA levels and 16S rDNA copy number for chorioamnionitis. Blue, green, yellow and purple lines indicate receiver operating characteristic curves for 16S rDNA, miR-191-5p, miR-1915-5p and miR-4535, respectively.
*p < 0.01; **p < 0.0001.
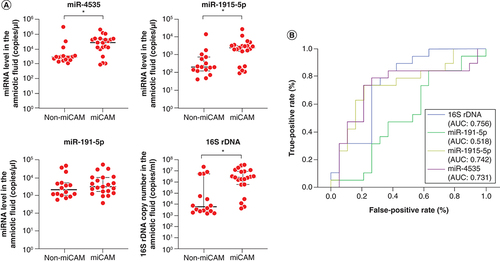
(A) Comparison of miR-4535, miR-1915-5p and miR-191-5p levels and 16S rDNA copy numbers in the amniotic fluid from pregnant women with microbiomic chorioamnionitis (miCAM) (n = 21) and without miCAM (non-miCAM) (n = 16). Data are expressed as the median ± 95% CI. Thick and thin bars indicate the median and 95% CI, respectively. (B) Diagnostic and predictive accuracies of miRNA expression and 16S rDNA copy number for chorioamnionitis and miCAM. Blue, green, yellow and purple lines indicate receiver operating characteristic curves for 16S rDNA, miR-191-5p, miR-1915-5p and miR-4535, respectively.
*p < 0.05.
CRP: C-reactive protein; miCAM: Microbiome chorioamnionitis; WBC: White blood cell.
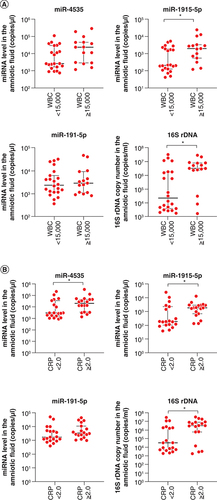
Data are expressed as the median ± 95% CI. Thick and thin bars indicate the median and 95% CI, respectively.
*p < 0.05.
CRP: C-reactive protein; WBC: White blood cell.
Data are expressed as the median ± 95% CI. Thick and thin bars indicate the median and 95% CI, respectively.
*p < 0.05.
CRP: C-reactive protein; WBC: White blood cell.
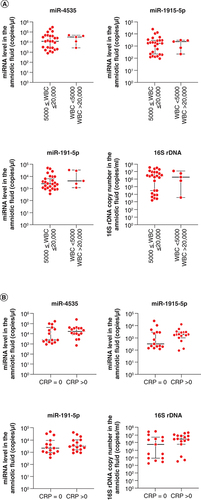
Table 2. Association of neonatal inflammatory indicators between newborns with the third quartile of miRNA levels in the amniotic fluid.
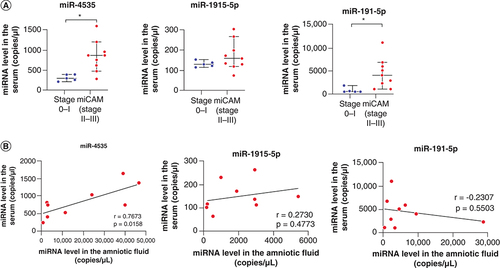
(A) Levels of miR-4535, miR-1915-5p and miR-191-5p in the serum of pregnant women with Blanc’s classification stages II–III and microbiomic chorioamnionitis (n = 9) and those with Blanc’s classification stages 0–I (n = 5). Data are expressed as the median ± 95% CI. Thick and thin bars indicate the median and 95% CI, respectively. (B) Correlation of the expression of miR-4535, miR-1915-5p and miR-191-5p in the amniotic fluid (x-axis) and serum (y-axis) of pregnant women with Blanc’s classification stages II–III and miCAM (n = 9). r indicates the correlation index.
*p < 0.05.
miCAM: Microbiome chorioamnionitis.