Figures & data
Table 1. Characteristics of the included literatures in the meta-analysis.
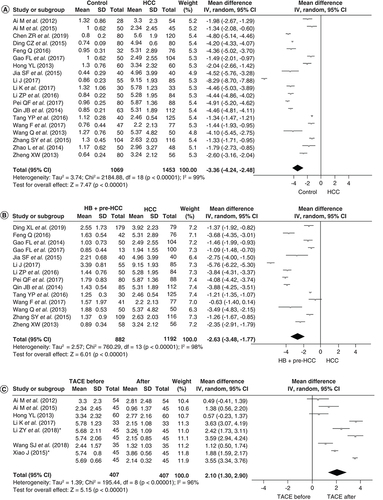
(A) Forest plots of healthy subjects and HCCs. (B) Forest plots of benign liver disease patients and HCCs. (C) Forest plots of HCCs before and one month after TACE.
*In , there were two separate patient groups which were treated with different types of chemotherapy. Each patient group included 45 cases. Black diamond indicates the mean value.
HCC: Hepatocellular carcinoma; IV: Inverse variance; SD: Standard deviation; TACE: Transarterial chemoembolization.
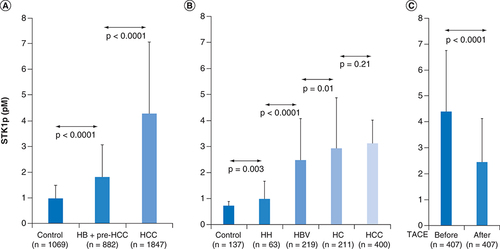
Comparison of STK1p level among controls, hepatic benign/pre-HCC and HCC (A); Comparison of STK1p level among controls, HH, HBV infections, HC and HCC (B); Comparison of STK1p levels before and after TACE treatment in HCC (C).
HBV: Hepatitis B virus; HC: Hepatic cirrhosis; HCC: Hepatocellular carcinoma; HH: Hepatic hemangiomas; STK1p: Serum thymidine kinase 1 protein concentration; TACE: Transarterial chemoembolization.
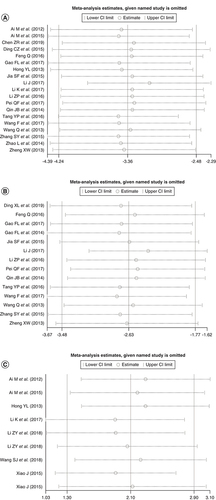
(B) Plots of the sensitivity between benign + pre-HCC and HCC. (C) Plots of the sensitivity between before and after TACE treatment in HCC.
HCC: Hepatocellular carcinoma; TACE: Transarterial chemoembolization.