Figures & data
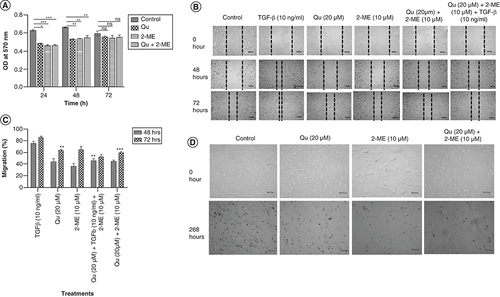
(A) Effect of drug treatment on PC-3 cell proliferation was analyzed by MTT assay, normalized with the control group and graph was plotted with OD at 540 nm on Y-axis and time on X-axis. Data represented as mean ± SEM from three independent experiments. The statistical analysis was performed using ANOVA with Tukey’s post hoc multicomparison test (*p < 0.05; **p < 0.01; ***p < 0.001). (B) Cell migration in scratch assay after treatment with all the three groups of drugs. Pictures were taken using an inverted microscope in various time points in triplicates. Data represented as mean ± SEM from three independent experiments. (C) Histogram plots with the percentage migration in the respective treatment group are shown as mean ± SEM from three independent experiments. The statistical analysis was performed using ANOVA with Tukey’s post hoc multicomparison test (*p < 0.05; **p < 0.01; ***p < 0.001). (D) Soft agar assay was performed to determine the colony-forming ability of PC-3 cells. PC-3 cells were harvested after 24 h of treatment and suspended in serum-free medium and plated in soft agar dishes prepared using 1% base agar and 0.7% top agar layers. Pictures were taken every 24 h using an inverted microscope to observe the transformation of cells.
2-ME: 2-methoxyestradiol; EMT: Epithelial–mesenchymal transition; OD: Optical density; Qu: Quercetin.
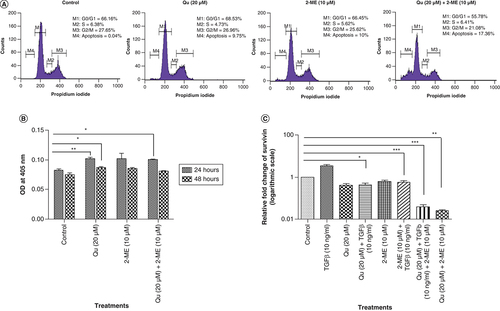
(A) Graph depicting the percentage of cells in different phases of the cell cycle was analyzed after treatment with all the three groups of drug. (B) Quantization of cleaved caspase 3 in PC-3 cells after treatment with all the three treatment groups. Data represented as mean ± SEM from three independent experiments. The statistical analysis was performed using ANOVA with Tukey’s post hoc multicomparison test (*p < 0.05; **p < 0.01; ***p < 0.001). (C) Effect of all the three different groups of drug on the mRNA expression of survivin. Gene levels were normalized with β-actin and expressed as fold change with respect to the control group. Data represented as mean ± SEM from three independent experiments. The statistical analysis was performed using ANOVA with Tukey’s post hoc multicomparison test (*p < 0.05; **p < 0.01; ***p < 0.001).
2-ME: 2-methoxyestradiol; EMT: Epithelial–mesenchymal transition; OD: Optical density; Qu: Quercetin.
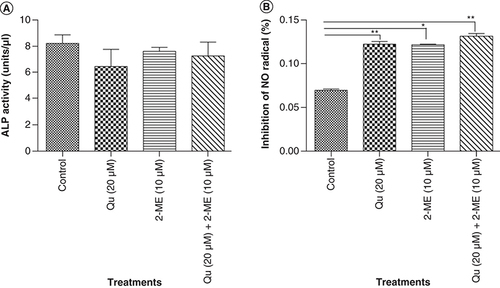
(A) Depicts % inhibition of NO2 upon treatment with all the three groups of drug. Data represented as mean ± SEM from three independent experiments. The statistical analysis was performed using ANOVA with Tukey’s post hoc multicomparison test (*p < 0.05; **p < 0.01; ***p < 0.001). (B) ALP activity was analyzed using colorimetric alkaline phosphates activity detection kit. Data represented as mean ± SEM from three independent experiments. The statistical analysis was performed using ANOVA with Tukey’s post hoc multicomparison test (*p < 0.05; **p < 0.01; ***p < 0.001).
2-ME: 2-methoxyestradiol; ALP: Alkaline phosphatase; EMT: Epithelial–mesenchymal transition; Qu: Quercetin.
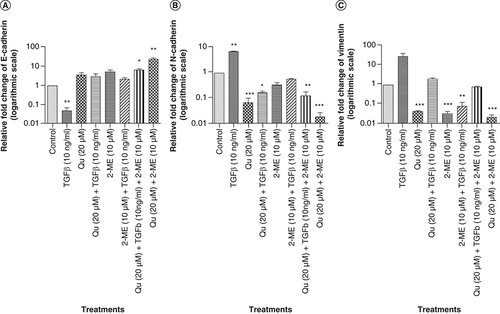
Effect of all the three different groups of drugs on the mRNA expression of EMT markers. (A) E-cadherin. (B) N-cadherin. (C) Vimentin. Gene mRNA levels were normalized with β-actin and expressed as fold change with respect to the control group. Data represented as mean ± SEM from three independent experiments. The statistical analysis was performed using ANOVA with Tukey’s post hoc multicomparison test (*p < 0.05; **p < 0.01; ***p < 0.001).
2-ME: 2-methoxyestradiol; EMT: Epithelial–mesenchymal transition; Qu: Quercetin.
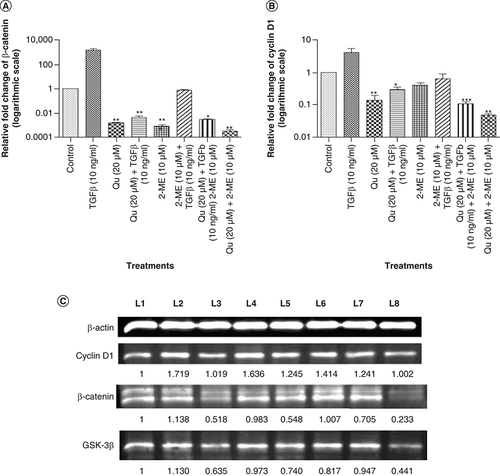
Effect of all the three different groups of drugs on the mRNA expression of Wnt components: (A) β-catenin and (B) cyclin D1. Gene mRNA levels were normalized with β-actin and expressed as fold change with respect to the control group. Data represented as mean ± SEM from three independent experiments. The statistical analysis was performed using ANOVA with Tukey’s post hoc multicomparison test (*p < 0.05; **p < 0.01; ***p < 0.001). (C) The expression of Wnt signaling proteins viz., cyclin D1 and β-catenin after treatment with different drug combinations was analyzed by western blotting. L1: Control; L2: TGF-β (20 ng/ml); L3: Quercetin (20 μM); L4: Quercetin (20 μM) + TGF-β (20 ng/ml); L5: 2-ME (10 μM); L6: 2-ME (10 μM) + TGF-β (20 ng/ml); L7: Quercetin (20 μM) + 2-ME (10 μM) + TGF-β (20 ng/ml); L8: Quercetin (20 μM) + 2-ME (10 μM).
2-ME: 2-methoxyestradiol; EMT: Epithelial–mesenchymal transition; Qu: Quercetin.