Figures & data
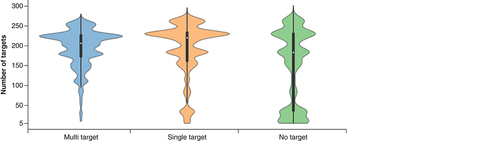
Violin plots report the distributions of targets against which MT-, ST- and NT-CPDs were experimentally tested. A violin plot combines a boxplot (black bar in the center) with a density plot (colored shape). In the density plot, the distribution shape of the data is visualized; the width of the density plot is proportional to the value frequency. In the boxplot, the LAV (bottom end of black line), lower quartile (lower boundary of the central bar), median (white dot in the bar), upper quartile (upper boundary of the bar) and UAV (top end of black line) of the value distribution are reported.
LAV: Lower adjacent value; MT-CPD: Multi-target compound; NT-CPD: No-target compound; ST-CPD: Single-target compound; UAV: Upper adjacent value.
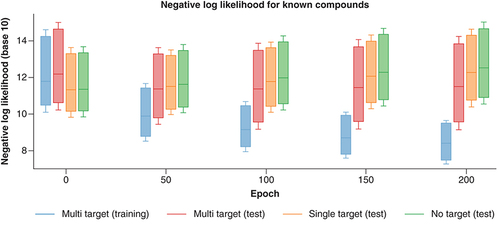
Boxplots report the distribution of NLL values for MT-, ST- and NT-CPDs during fine-tuning of the REINVENT model after 0, 50, 100, 150 and 200 epochs. For clarity, statistical outliers are omitted.
MT-CPD: Multi-target compound; NLL: Negative log-likelihood; NT-CPD: No-target compound; ST-CPD: Single-target compound.