Figures & data
Table 1. Demographic and clinical characteristics that differ across ABO blood type groups.
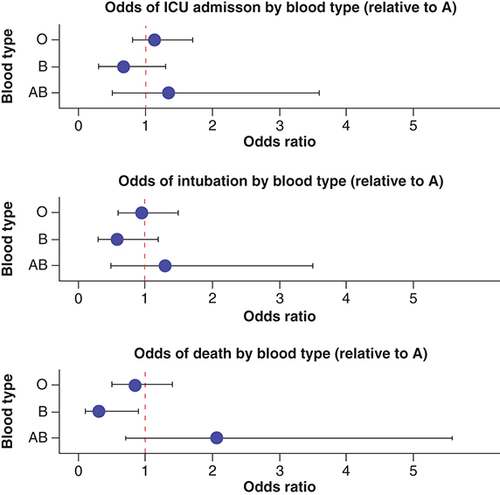
Odds of ICU admission, intubation and death for blood types O, B and AB relative to blood type A. The odds of death was lower among blood type B relative to blood type A on univariate analysis.
ICU: Intensive care unit.