Figures & data
Table 1. Clinicopathological findings of the biliary tract carcinoma we examined.
There were two subgroups that were stratified by cluster analysis in biliary tract carcinoma based on SCNA patterns.
SCNA: Somatic copy number alteration.
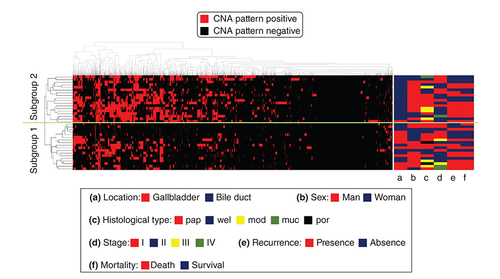
Table 2. Clinicopathological findings of each subgroup.
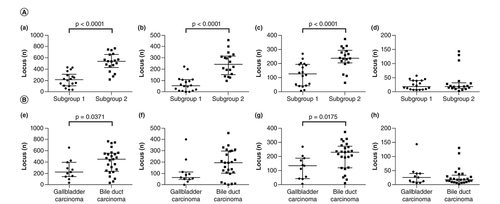
(A) Number of loci with somatic copy number alterations in subgroups 1 and 2. There were significant differences in the median numbers of gains and LOHs between subgroups (p < 0.0001). (a) All SCNA patterns; (b) gain pattern; (c) loss of heterozygosity pattern; (d) copy neutral loss of heterozygosity pattern; Number of loci with SCNAs in gall bladder carcinoma and bile duct carcinoma. (e) All SCNA patterns; (f) gain pattern; (g) loss of heterozygosity pattern; (h) copy neutral loss of heterozygosity pattern.
LOH: Loss of heterozygosity; SCNA: Somatic copy number alteration.