Figures & data
Table 1. Distribution of various factors in the training and verification cohorts.
Table 2. Univariate and multivariate analysis of prognostic factors for overall survival in the training cohort.
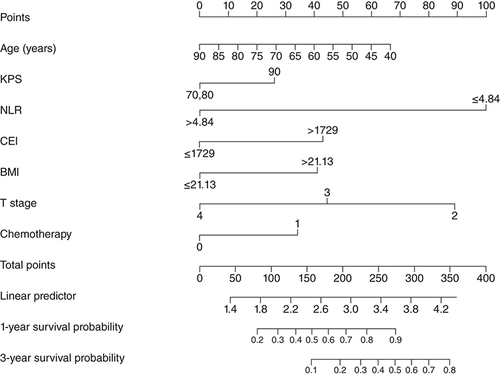
CEI: Cervical esophageal carcinoma index; KPS: Karnofsky performance status; NLR: Neutrophil to lymphocyte ratio; T: Tumor.
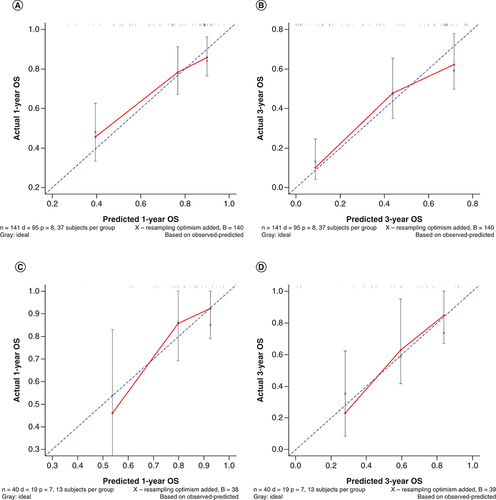
(A & B) Calibration curves of nomogram to (A) 1-year overall survival and (B) 3-year overall survival in the training cohort. (C & D) Calibration curves of nomogram to (C) 1-year overall survival and (D) 3-year overall survival in the verification cohort.
OS: Overall survival.
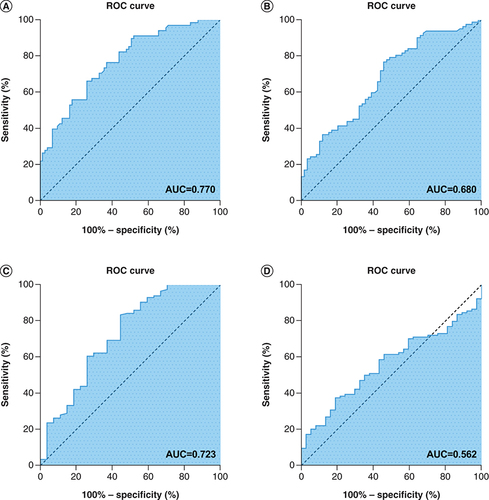
(A) Receiver operating characteristic (ROC) curve analysis of the nomogram model for overall survival (OS) in patients with esophageal squamous cell carcinoma (ESCC) (AUC = 0.731). (B) ROC curve analysis of the BMI for OS in patients with ESCC (0.598). (C) ROC curve analysis of the neutrophil to lymphocyte ratio for OS in patients with ESCC (0.506). (D) ROC curve analysis of the cervical esophageal carcinoma index for OS in patients with ESCC (0.514).
AUC: Area under the curve.
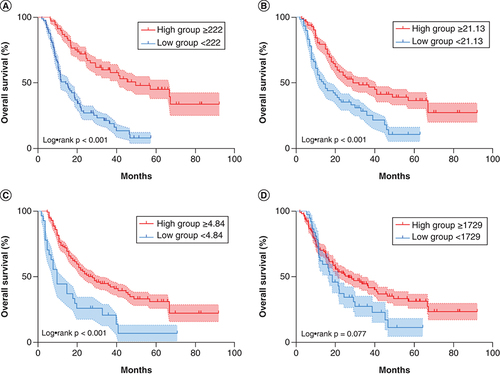
The Kaplan–Meier curves and p-value represents the relationship between (A) overall survival (OS) and nomogram model (p < 0.001), (B) OS and BMI (p < 0.001), (C) OS and neutrophil to lymphocyte ratio (p < 0.001) and (D) OS and cervical esophageal carcinoma index (p = 0.077).