Figures & data
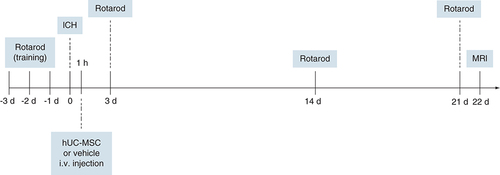
hUC-MSC: Human umbilical cord-derived mesenchymal stromal cells; ICH: Intracerebral hemorrhage; iv.: Intravenous; MRI: Magnetic resonance imaging.
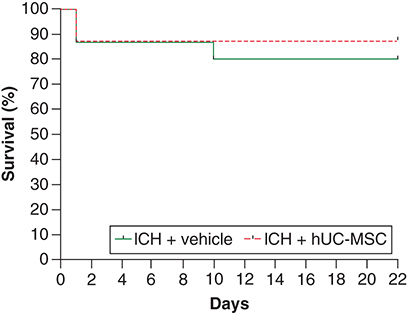
Animals were treated with (ICH + hUC-MSC) or with the vehicle (ICH + vehicle) 1 h after the induction of ICH. The graph shows the survival curves during the 22 days of follow-up. Log-rank test (Mantel–Cox test) was used. n = 15 (ICH + vehicle) and n = 16 (ICH + hUC-MSC) rats per group.
hUC-MSC: Human umbilical cord-derived mesenchymal stromal cells; ICH: Intracerebral hemorrhage.
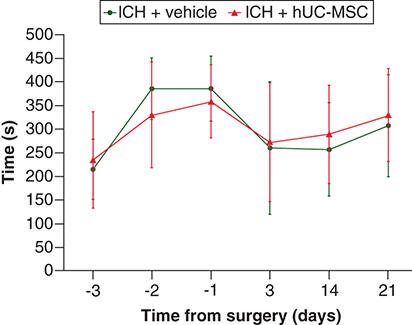
Animals were treated with (ICH + hUC-MSC) or with the vehicle (ICH + vehicle) 1 h after the induction of ICH. The graph shows the latencies to fall in the rotarod test at different time points from surgery. Mixed-effects analysis and Sidák’s post-hoc test were used. Data shown in the graph are means ± SD; n = 12-13 animals in the ICH + vehicle group, n = 14 animals in the ICH + hUC-MSC group.
hUC-MSC: Human umbilical cord-derived mesenchymal stromal cells; ICH: Intracerebral hemorrhage; SD: Standard deviation.
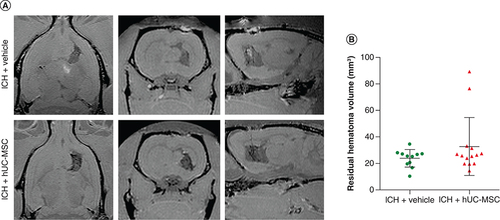
Animals were treated with (ICH + hUC-MSC) or with the vehicle (ICH + vehicle) 1 h after the induction of ICH. (A) Representative T1-weighted images obtained with a 3D sequence in a 2 Tesla MRI scanner 22 days after the induction of ICH. (B) Graph showing the quantification of the residual hematoma volume. Data shown in the graphs are individual values, and means ± SD Mann–Whitney U test; n = 11 (ICH + vehicle) and n = 14 (ICH + hUC-MSC) rats per group.
hUC-MSC: Human umbilical cord-derived mesenchymal stromal cells; ICH: Intracerebral hemorrhage.