Figures & data
(A) H&E image in 100x magnification showing representative photomicrograph of the case of Kaposiform hemangioendothelioma with cannonball pattern of arrangement and slit like vascular spaces lined by mildly pleomorphic endothelial cells. There is no significant atypia and no mitotic figures. (B) Immunostain for FLI-1 showing nuclear positivity in the endothelial cells. (C) H&E image in 200x magnification showing representative photomicrograph from a case of epithelioid hemangioendothelioma with cells with epithelioid morphology showing mild to moderate pleomorphism with abundant eosinophilic cytoplasm. Many cells show presence of intracytoplasmic lumina characteristic of endothelial cells. (D) Immunostain for CD31 antigen showing membrano-cytoplasmic positivity in endothelial cells.
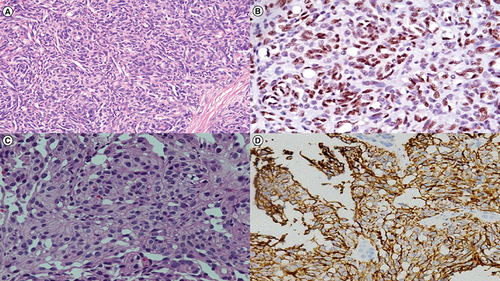
Table 1. Clinico-epidemiological profile of cases under study.
Table 2. Details of patients in the study including clinical presentation, histologic subtype, treatment given with response and outcomes.
Table 3. Details of therapy received, toxicity and survival outcomes.
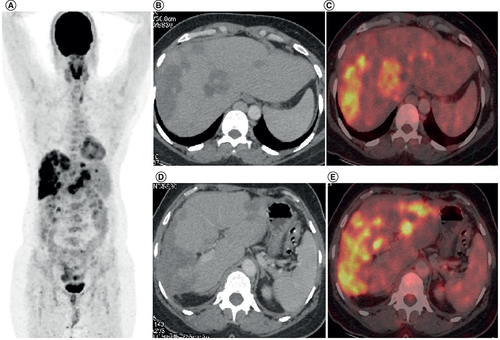
This scan represents the radiological findings prior to initiation of pazopanib-based therapy for this patient. (A) MIP image FDG PET-CT showing increased tracer uptake in the hepatic region. (B & D) Axial CT abdomen showing confluent hypodense lesions in both the lobes of liver. (C & E) There is increased tracer uptake noted at the liver lesions in the fused PET-CT images.
MIP: Maximum intensity projection.
(A) Maximum intensity projection image FDG PET-CT showing physiologic tracer uptake in brain, myocardium and urinary bladder and no abnormal tracer uptake in the hepatic region. (B & D) Axial CT abdomen showing confluent hypodense lesions in both the lobes of liver. (C & E) There is no significant abnormal tracer uptake in fused PET-CT images suggestive of complete metabolic response.
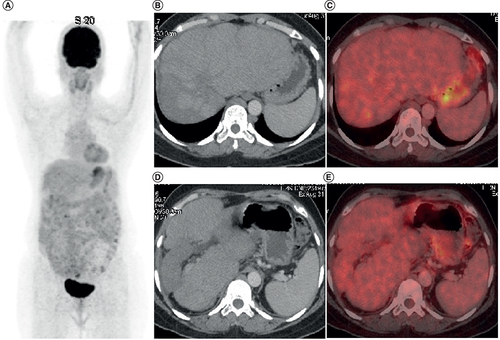
EHE: Epithelioid hemangioendothelioma.