Figures & data
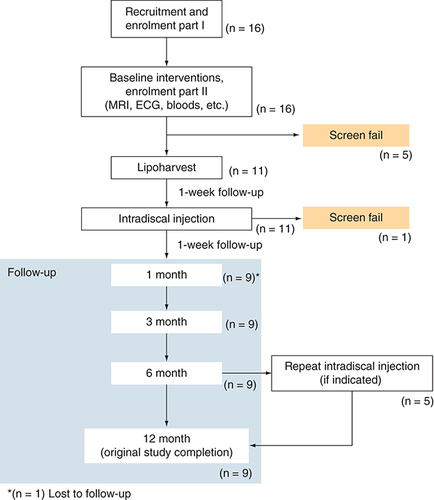
Table 1. Eligibility criteria for participants.
Table 2. Average cell count and viability confirmed using a muse cell analyzer.
Table 3. Tools used for the evaluation of outcome measures.
Table 4. Participant demographics.
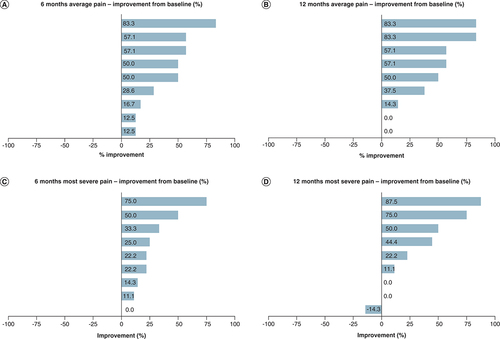
(A) Average pain scores at 6 months. (B) Average pain scores at 12 months. (C) Most severe pain at 6 months. (D) Most severe pain at 12 months.
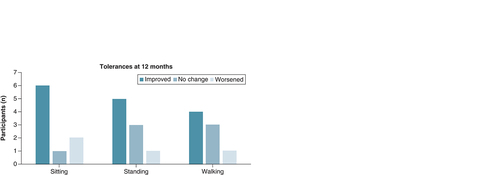
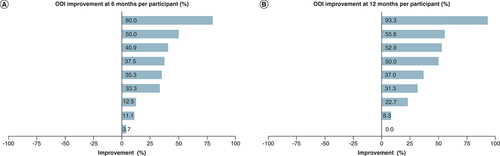
(A) 6 months. (B) 12 months.
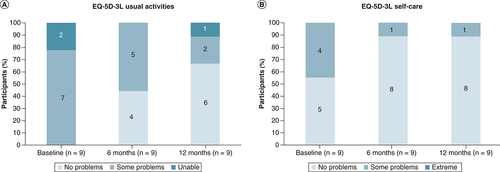
(A) Usual activities. (B) Self-care.
(A) Categorical PGIC data. (B) Participant satisfaction survey.
PGIC: Patient global impression of change.
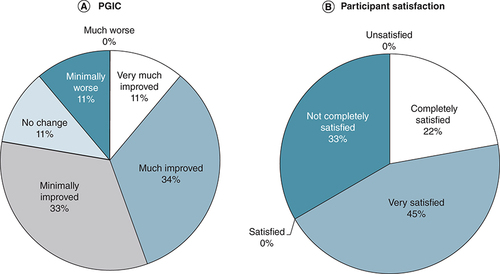
Table 5. Baseline and 12-month MRI findings.
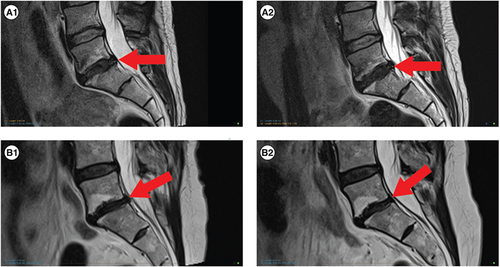
(A1 & 2) Represents participant 04 from and shows no changes from baseline to follow-up. (A1) Participant 04, baseline. (A2) Participant 04, 12 months. (B1 & 2) Represents participant 07 from and shows no changes in disc height, no progression of Modic 2 endplate changes and a reduction in disc protrusion size. (B1) Participant 05, baseline. (B2) Participant 05, 12 months.