Figures & data
Table 1. Docking scores of top 20 compounds with SARS-CoV-2 Mpro and their Chinese herbal medicine sources.
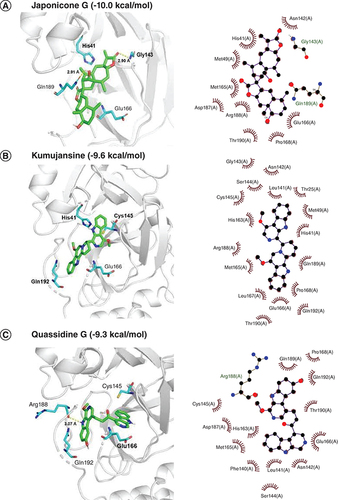
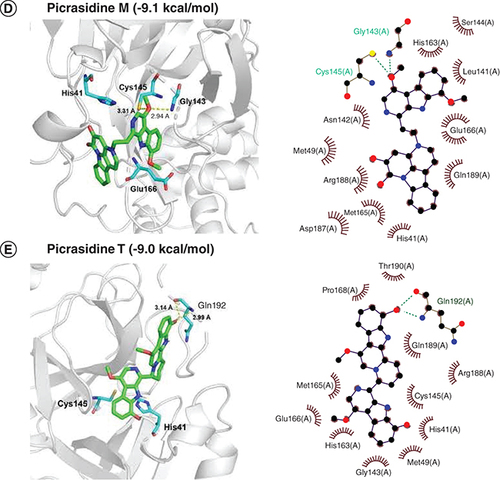
Docked comformations of (A) Japonicone G, (B) Kumujansine, (C) Quassidine G, (D) Picrasidine M and (E) Picrasidine T within the active site of SARS-CoV-2 Mpro along with their corresponding 2D interaction plots.
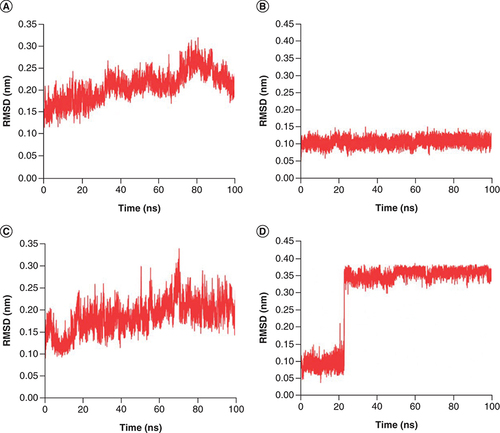
RMSD plot of complex Japonicone G and Picrasidine T with SARS-CoV-2 Mpro during 100 ns MD simulation, respectively: (A) Mpro in complex with Japonicone G; (B) Japonicone G in complex; (C) Mpro in complex with Picrasidine T; (D) Picrasidine T in complex.
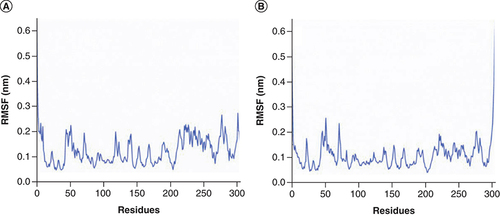
RMSF plot of SARS-CoV-2 Mpro (C-alpha atom) in two complexes during 100 ns MD simulations, respectively: (A) Mpro in complex with Japonicone G; (B) Mpro in complex with Picrasidine T.
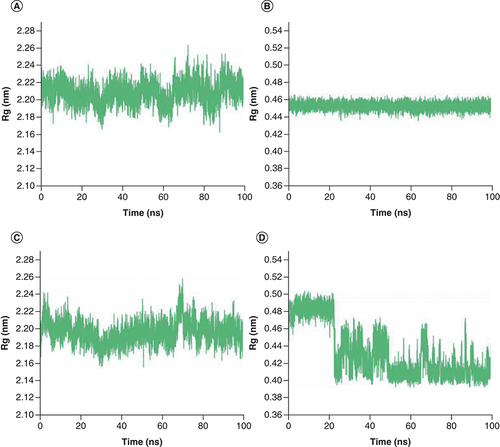
Rg plot of complex Japonicone G and Picrasidine T with SARS-CoV-2 Mpro during 100 ns MD simulation, respectively: (A) Mpro in complex with Japonicone G; (B) Japonicone G in complex; (C) Mpro in complex with Picrasidine T; (D) Picrasidine T in complex.
Hydrogen bond number plot of complex (A) Japonicone G and (B) Picrasidine T with SARS-CoV-2 Mpro during 100 ns MD simulation, respectively.
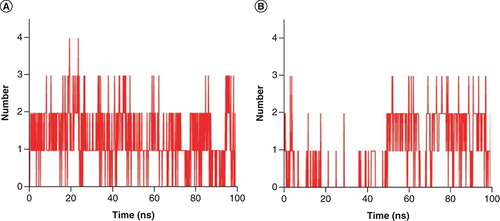
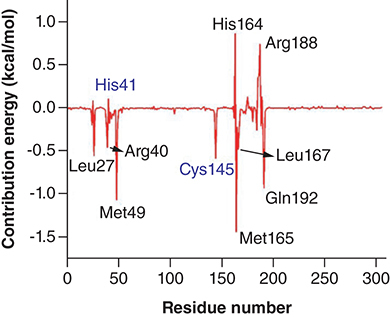
Table 2. Contribution of each energy element (in kcal/mol) for the interaction of SARS-CoV-2 Mpro with Japonicone G.