Figures & data
Figure 1. Atomic force microscopy image of graphene oxide flakes and height profiles of graphene oxide nanosheets.
(A) Atomic force microscopy lateral image of graphene oxide. (B) The height profiles of graphene oxide.
AFM: Atomic force microscopy; GO: Graphene oxide.
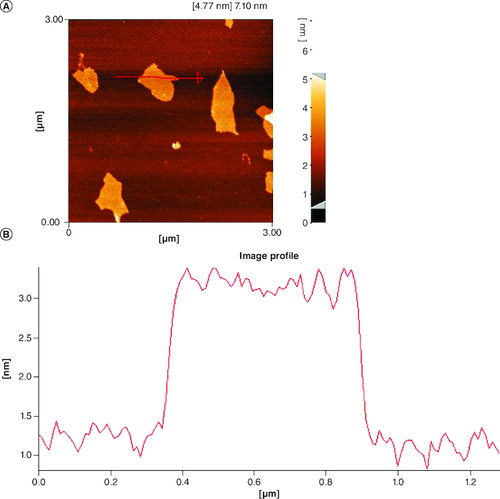
Figure 2. Powder x-ray diffraction patterns of graphene oxide.
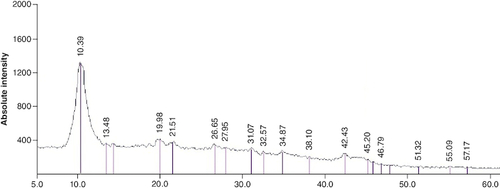
Figure 3. Fourier transform infrared spectra of CS, GO, ZnO, CS–ZnO CS–GO and CS–ZnO–GO hybrid structure.
CS: Chitosan; CS–ZnO CS–GO: Chitosan–Zinc oxide Chitosan–Graphene oxide; CS–ZnO–GO: Chitosan–Zinc oxide–Graphene oxide; GO: Graphene oxide; ZnO: Zinc oxide.
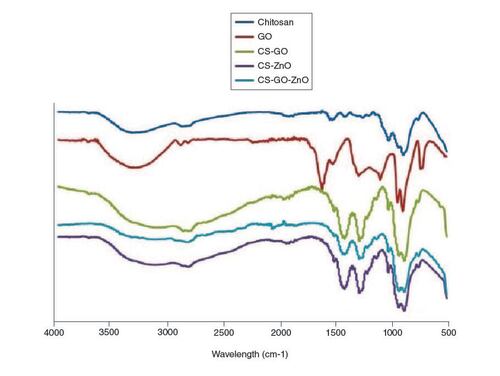
Figure 4. TGA-DTG curve representing thermal decomposition of CS–ZnO–GO nanocomposite film.
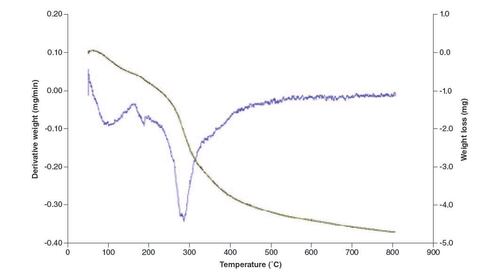
Figure 5. Wound contraction evaluation.
Changes in wound size for different groups.
**p < 0.01.
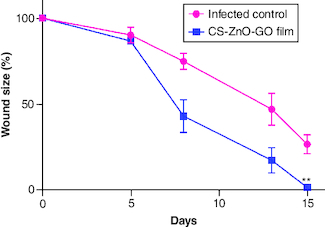
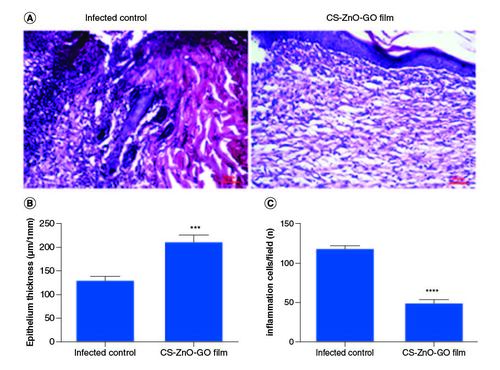
Figure 6. Histopathological examinations.
(A) Representative H&E stained tissue slices from different groups on day 15. Wound healing statistical data of different groups after 15 days of treatment. (B) Epithelium thickness (μm/1 mm). (C) Number of inflammation cells/field.
****p < 0.0001; ***p < 0.001.
CS–ZnO–GO:Chitosan–zinc oxide–graphene oxide.