Figures & data
Figure 1. Literature retrieval and selection processes.
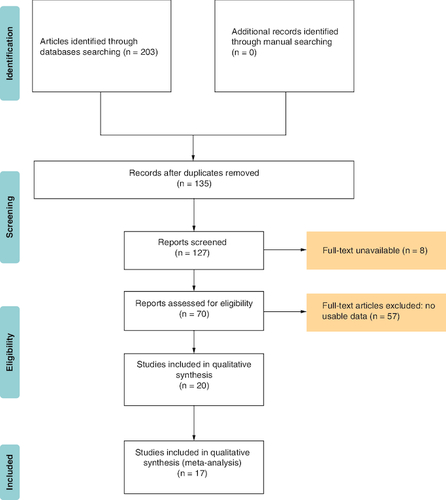
Table 1. The information of enrolled articles in the meta-analysis.
Figure 2. Meta-analysis of the pooled hazard ratios of overall survival and disease-free survival.
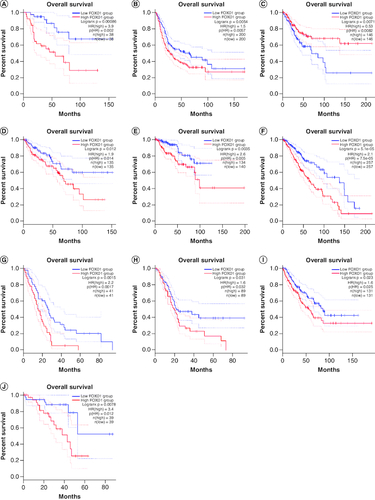
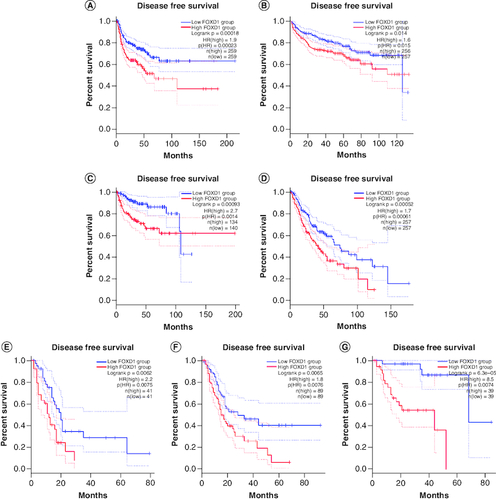
(A) Meta-analysis of the pooled HRs of OS in cancer patients. A fixed-effect model was used for 17 studies. The pooled outcomes demonstrated a lower OS for people with most tumors with high-expression of FOXD1 if compared with those with low-expression of FOXD1 (HR: 1.355; 95% CI: 1.236–1.474; p < 0.001). (B) Meta-analysis of the pooled HRs of OS in cancer patients multivariate analysis. The meta-analysis of the pooled HRs of OS in cancer patients multivariate analysis is (HR: 1.969; 95% CI: 1.530–2.408; p < 0.001). (C) Meta-analysis of the pooled HRs of DFS in cancer patients. A fixed-effects model was also employed for four studies. Revealing a marked connection between elevated degrees of FOXD1 and worse DFS (HR: 1.442; 95% CI: 1.035–1.854; p < 0.001).
HR: Hazard ratio; OS: Overall survival.
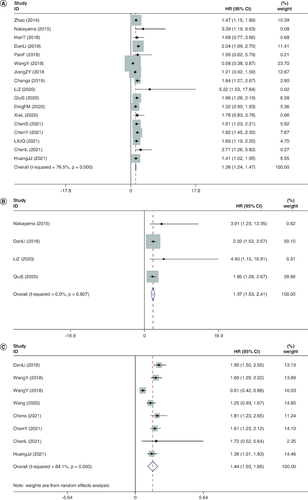
Table 2. Meta-analysis of the relationship between overexpressed FOXD1 and clinicopathological parameters.
Figure 3. Funnel plots of publication bias about the correlation between FOXD1 expression and hazard ratios of overall survival in the cancer patients.
None publication bias for overall survival was discovered in the researches recruited by utilizing Begg's Test (Z = 0.62, Pr > |z| = 0.538) as well as Egger's p-value (p = 0.948).
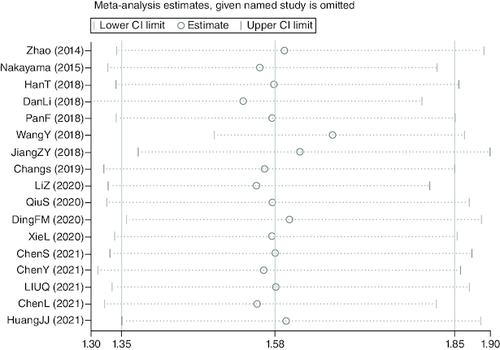
Figure 4. Sensitivity analysis evaluating the influence of individual study on the pooled estimate.
There was no discernible impact on the pooled hazard ratio, indicating the comparative robustness of the outcome.
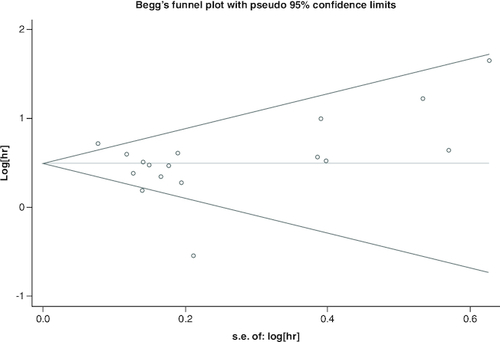
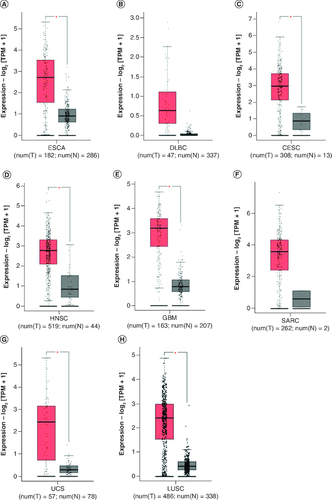
Figure 5. FOXD1 expression in seven types of cancer versus normal tissue.
‘*’ |Log2Fold Change| >1 and p < 0.01. The red box plots represent FOXD1 expression in cancer tissues and the gray box plots represent FOXD1 expression in normal tissues.
CESC: Cervical squamous cell carcinoma and endocervical adenocarcinoma; DBLC: Lymphoid neoplasm large B-cell lymphoma; ESCA: Esophageal cancer; HNSC: Head and neck squamous cell carcinoma; GBM: Glioblastoma multiforme; LUSC: Lung squamous cell carcinoma; SARC: Sarcoma; UCS: Uterine carcinosarcoma.