
Figures & data
Figure 1. The diagram of this study.
AJCC: American Joint Committee on Cancer; NSCLC: Non-small-cell lung cancer; SEER: Surveillance, Epidemiology and End Results.
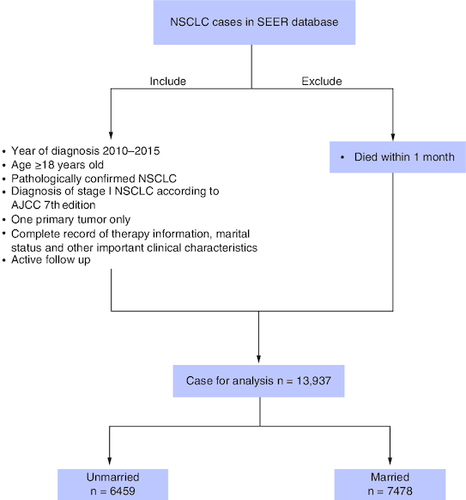
Table 1. The baseline clinical characteristics of enrolled patients with stage I non-small-cell lung cancer before and after propensity-score matching.
Figure 2. Cancer-specific survival curve for cohort of patients with non-small-cell lung cancer according to the status.
(A) Marriage and (B) surgery after propensity-score matching.
CSS: Cancer-specific survival.
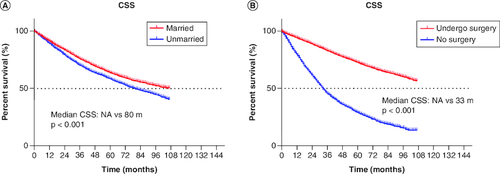
Table 2. Univariable and multivariable Cox regression analysis for cancer-specific survival.
Figure 3. The proportion of the patients with non-small-cell lung cancer.
In (A) surgery, (B) chemotherapy and (C) radiotherapy according to marital status.
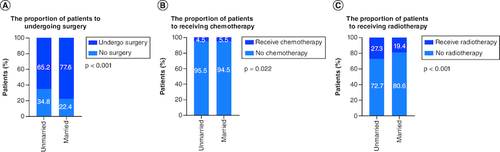
Figure 4. Kaplan–Meier survival curves.
(A) CSS in undergo surgery patients before PSM, (B) CSS in undergo surgery patients after PSM.
CSS: Cancer-specific survival; PSM: Propensity score matching.
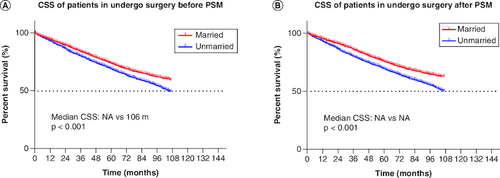
Table 3. Multivariable Logistic regression analysis for different treatment according to marital status (method is enter selection).