Figures & data
Table 1. Primers sequence for RT-PCR analysis.
Figure 1. A comparative study between Ti-DOX, Lac-DOX, cisplatin, Ti-CIS, Lac-CIS and neupogen and their impact on Hprt and C-Myc gene expression post DMBA-induced leukemia.
Data are expressed as mean ± S.E.M (n = 8). p ≤ 0.05 value is considered significant. Groups having the same letter are not significantly different from each other, while those having different letters are significantly different from each other. β-actin was used as reference gene.
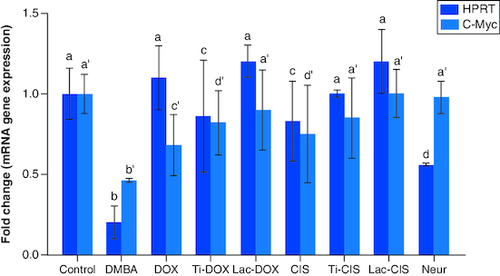
Figure 2. A comparative study between TiNPs-DOX, Lac-DOX, Cisplatin, TiNPs-CIS, Lac-CIS and Neupogen and their impact on KRAS gene expression post DMBA-induced leukemia.
Data are expressed as mean ± S.E.M (n = 8). p ≤ 0.05 value is considered significant. Groups having the same letter are not significantly different from each other, while those having different letters are significantly different from each other. β-actin was used as reference gene.
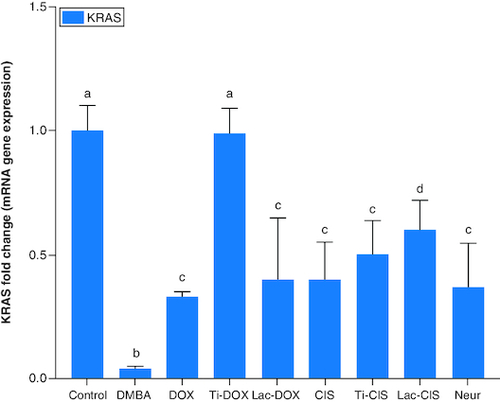
Figure 3. A comparative study between TiNPs-DOX, Lac-DOX, Cisplatin, TiNPs-CIS, Lac-CIS and Neupogen and their impact on SAT-2 gene expression post DMBA-induced leukemia.
Data are expressed as mean ± S.E.M (n = 8). p ≤ 0.05 value is considered significant. Groups having the same letter are not significantly different from each other, while those having different letters are significantly different from each other. β-actin was used as reference gene.
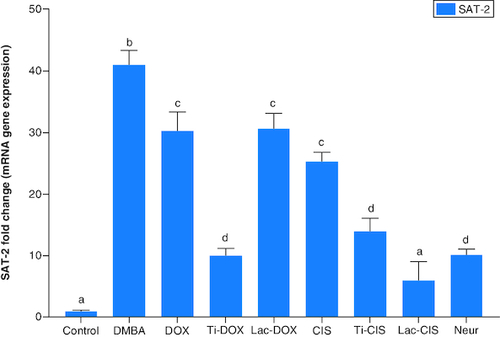
Figure 4. A comparative study between TiNPs-DOX, Lac-DOX, Cisplatin, TiNPs-CIS, Lac-CIS and Neupogen and their impact on P53 and JAK-2 protein expression post DMBA-induced leukemia.
Data are expressed as mean ± S.E.M (n = 8). p ≤ 0.05 value is considered significant. Groups having the same letter are not significantly different from each other, while those having different letters are significantly different from each other.
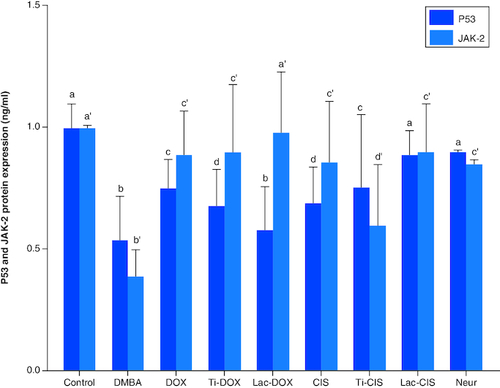
Figure 5. A comparative study between DOX, Ti-DOX, Lac-DOX, cisplatin, Ti-CIS, Lac-CIS and Neupogen and their impact on iron and hemoglobin levels post DMBA-induced leukemia.
Data are expressed as mean ± S.E.M (n = 8). p ≤ 0.05 value is considered significant. Groups having the same letter are not significantly different from each other, while those having different letters are significantly different from each other.
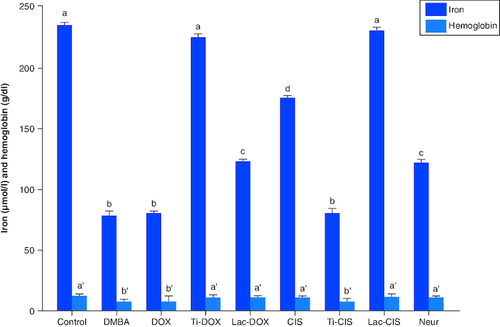
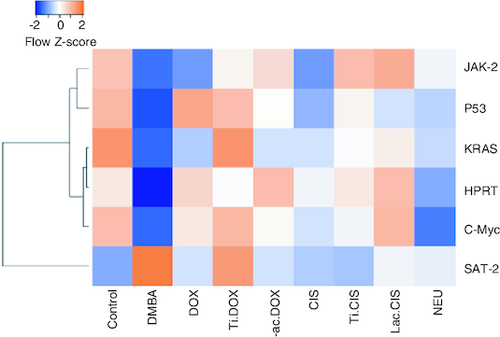
Figure 6. Heatmap representing different genes expression and their correlation.
Orange represent high score while blue represent low score.