Figures & data
Table 1. Impact of sophoretin and/or MLN on hemoglobin concentration in hypoxic rats.
Figure 1. Influence of sophoretin and/or melatonin on brain hypoxia inducible factor gene expression and HSP-70, IL-6 and TNF-α protein expression post NaNO2-induced hypoxia.
Data are expressed as means ± SEM (n = 10). A p-value <0.05 is considered significant. Groups having the same letter are not significantly different, while those having different letters are significantly different.
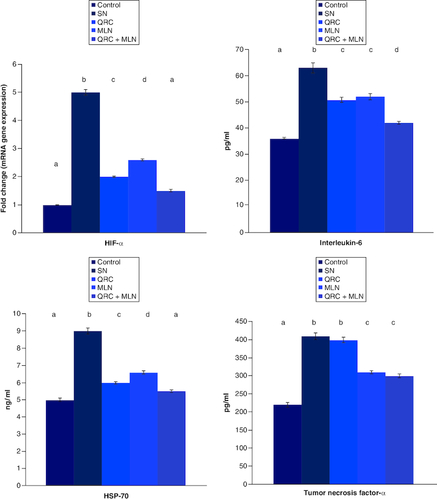
Figure 2. Influence of sophoretin and/or melatonin on serum dopamine, GABA, serotonin and norepinephrine levels following NaNO2-induced hypoxia.
Data are expressed as means ± SEM (n = 10). A p-value <0.05 is considered significant. Groups having the same letter are not significantly different, while those having different letters are significantly different.
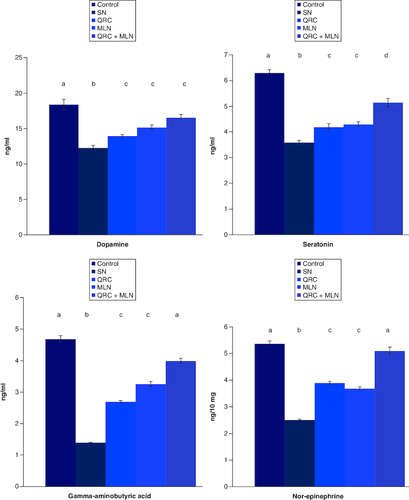
Table 2. Fischer's ratio oligopeptide determination and plasma amino acid concentrations as well as different nitrogenous compounds in (nmol/ml) in ischemic hypoxic rats, MLN and sophoretin-treated groups.
Figure 3. Single-cell gel electrophoresis (SCGS; COMET) assay showing the degree of DNA damage in the brain tissue.
Of (A) control group revealing no significant DNA damage. (B) The SN hypoxic group revealing a highly significant DNA damage represented by tail length. (C) The sophoretin-treated group revealing low DNA damage. (D) The melatonin treated group with moderate DNA damage. (E) The sophoretin and melatonin-treated group with the lowest DNA damage.
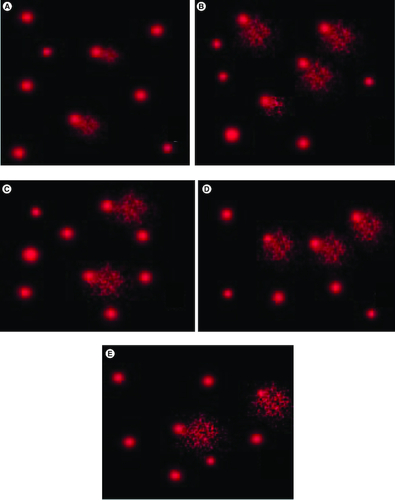
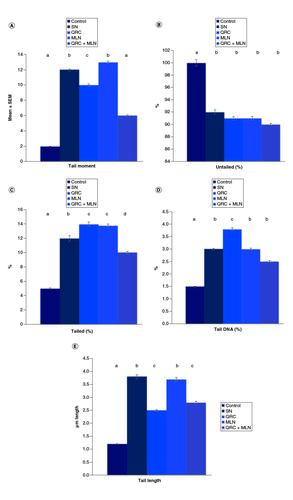
Figure 4. Influence of sophoretin and/or melatonin on DNA damage (tail moment, length and tail DNA %) following NaNO2 induced hypoxia.
(A) Percentage of tail moment, (B) percentage of untailed, (C) tailed percentage, (D) tail DNA percentage, (E) tail length in SN hypoxic group and different treated groups. Data are expressed as means ± SEM (n = 10). P-value <0.05 is considered significant. Groups having the same letter are not significantly different, while those having different letters are significantly different.